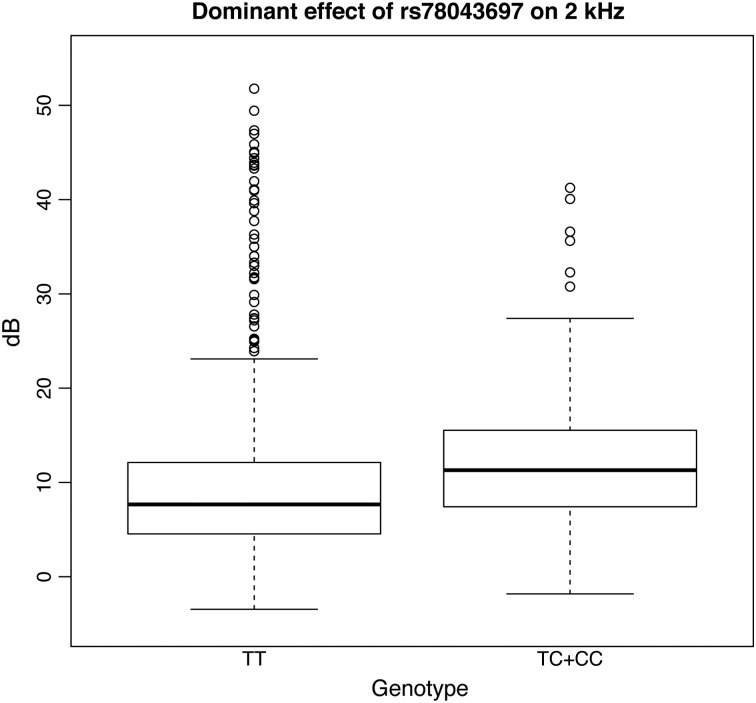
Figure 2.
Boxplot for rs78043697. The figure displays boxplots for the 2 kHz frequency trait divided by genotype groups for rs78043697 and adjusted by sex, age and relatedness in our largest cohort (INGI-FVG). As the effect for this SNP was observed under a dominant model, the heterozygote genotype TC and the homozygote CC are shown together.

