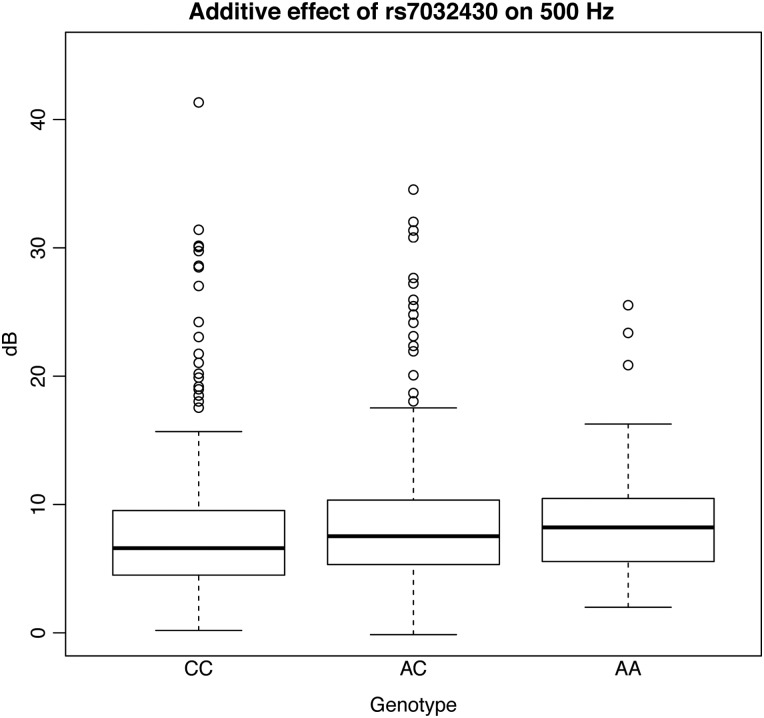
Figure 4.
Boxplot for rs7032430. The figure displays boxplots for the 500 Hz frequency divided by genotype groups for rs7032430 and adjusted by sex, age and relatedness in our largest cohort (INGI-FVG). As shown in the figure, people carrying the AA genotype have higher values and hence worse hearing function.

