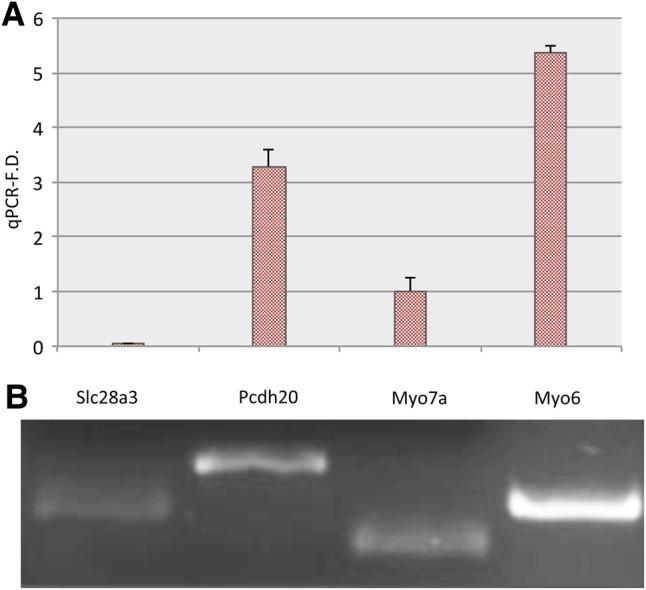
Figure 6.

(A) qReal-time analysis of the selected genes (PCDH20, SLC28A3). (B) Semi-quantitative RT-PCR. The plot shows expression for Pcdh20 and Slc28a3, compared with Myo7a and Myo6 (A). The y-axis represents a scale whose unit is the expression of the reference gene Myo7a. Pcdh20 displays a strong expression, whereas Slc28a3 shows lower levels. Semi-quantitative RT-PCR demonstrates that both genes are expressed (B).
