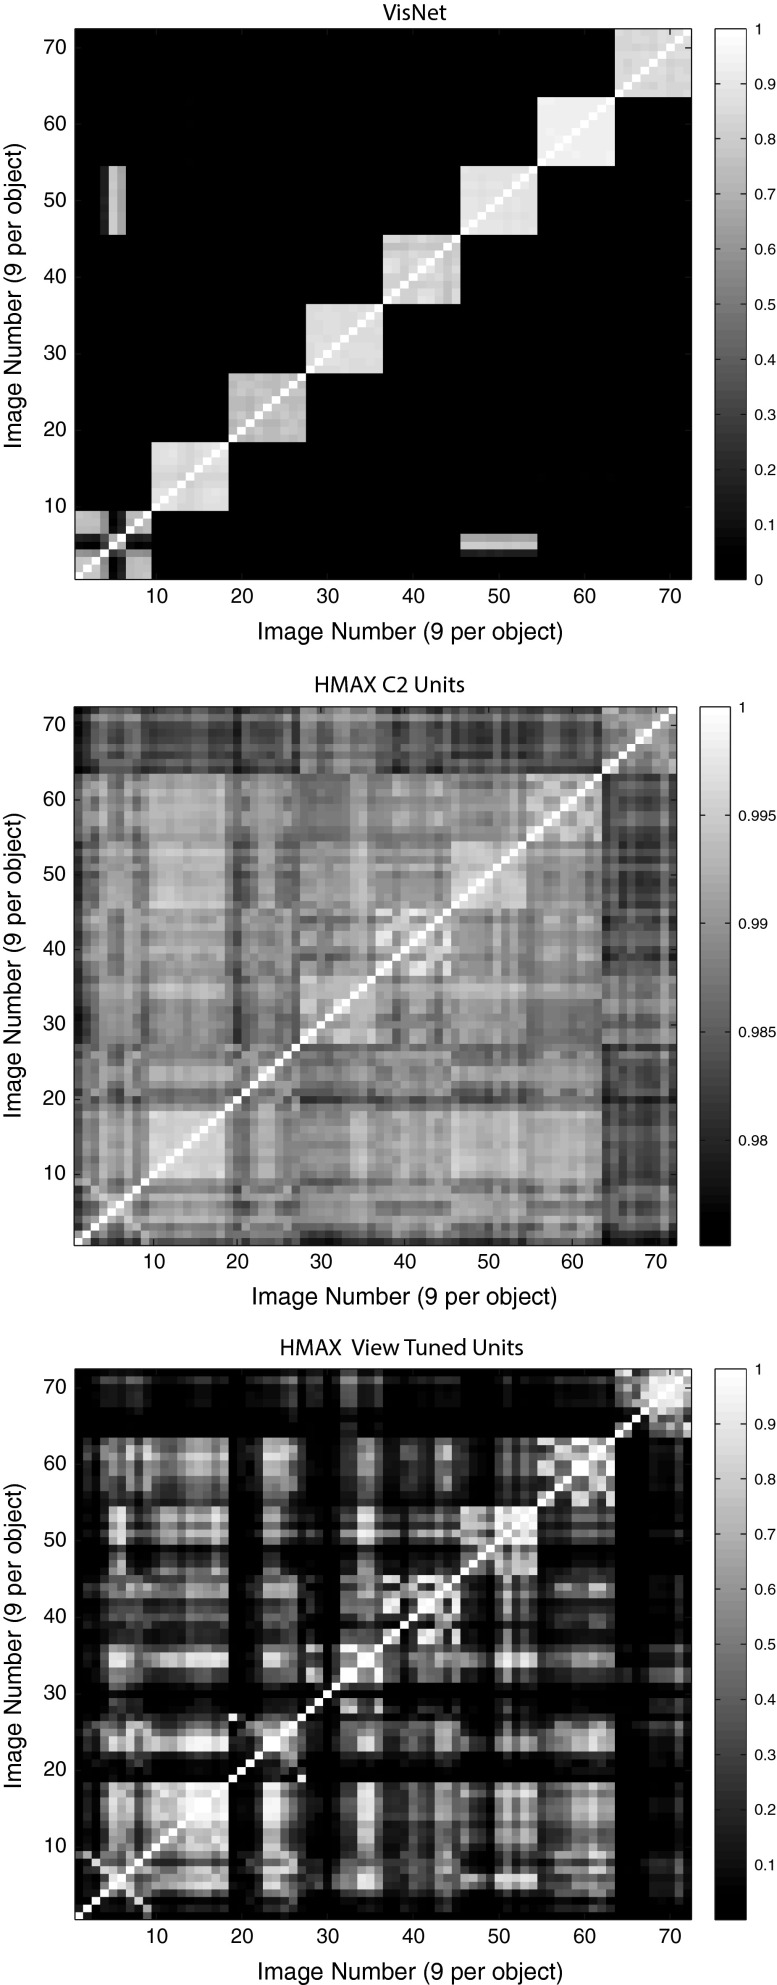
Fig. 10.
Similarity between the outputs of the networks between the 9 different views of 8 objects produced by VisNet (top), HMAX C2 (middle), and HMAX VTUs (bottom) for the Amsterdam Library of Images test. Each panel shows a similarity matrix (based on the cosine of the angle between the vectors of firing rates produced by each object) between the 8 stimuli for all output neurons of each type. The maximum similarity is 1, and the minimal similarity is 0

