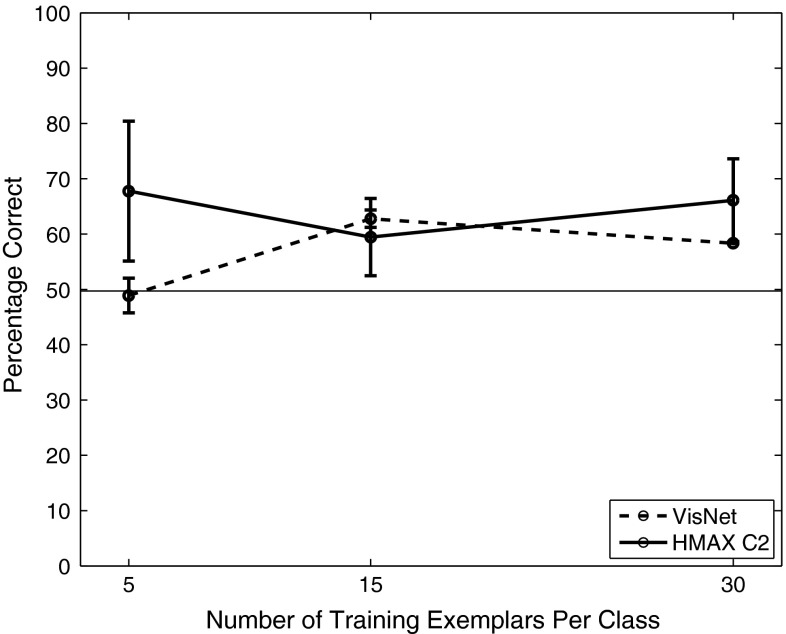
Fig. 4.
Performance of HMAX and VisNet on the classification task (measured by the proportion of images classified correctly) using the Caltech-256 dataset and linear support vector machine (SVM) classification. The error bars show the standard deviation of the means over three cross-validation trials with different images chosen at random for the training set on each trial. There were two object classes, hats and beer mugs, with the number of training exemplars shown on the abscissa. There were 30 test examples of each object class. All cells in the C2 layer of HMAX and layer 4 of Visnet were used to measure the performance. Chance performance at 50 % is indicated

