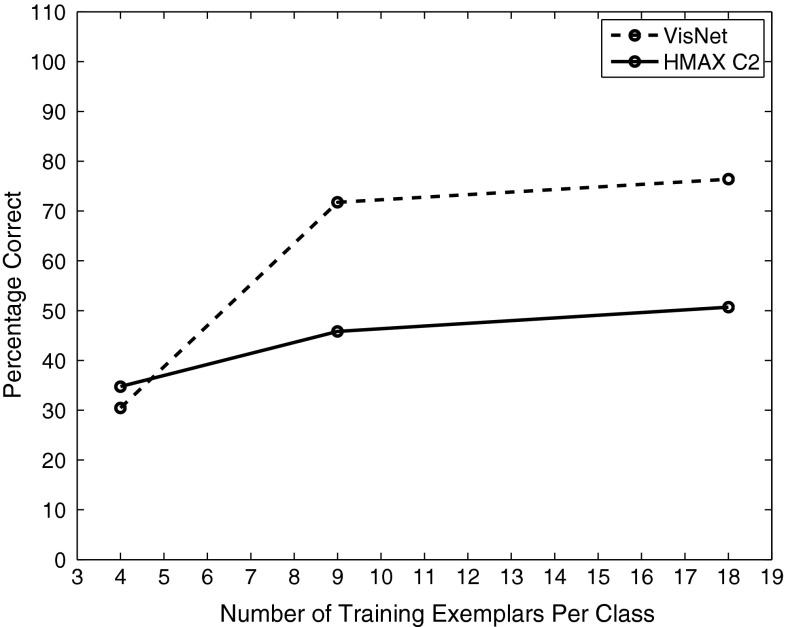
Fig. 7.
Performance of VisNet and HMAX C2 units measured by the percentage of images classified correctly on the classification task with 8 objects using the Amsterdam Library of Images dataset and measurement of performance using a pattern association network with one output neuron for each class. The training set consisted of 4 views of each object spaced apart; or 9 views spaced apart; or 18 views spaced apart. The test set of images was in all cases a cross-validation set of 18 views of each object spaced apart and offset by from the training set with 18 views and not including any training view. The 10 best cells from each class were used to measure the performance. Chance performance was 12.5 % correct

