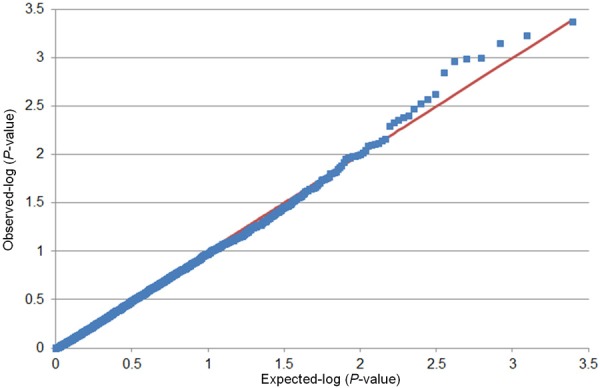
Figure 1.

Quantile-quantile plots of the association results for uterine leiomyoma (UL) size with inclusion of the control group. P-values were obtained from multivariable-adjusted logistic models in a pooled sample of 916 UL cases and UL-free controls. The plots show the observed versus expected P-values obtained in association tests of 2,484 single nucleotide polymorphism.
