Figure 1.

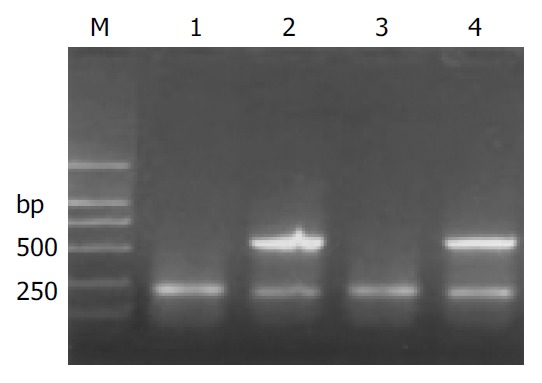
Expression of HPA mRNA in HCC. M: molecular mass markers (DL2000); lanes 1 and 3: the noncancerous liver tissue; lanes 2 and 4: the HPA positive samples of cancer tissues both with a bright band at 585 bp.

Expression of HPA mRNA in HCC. M: molecular mass markers (DL2000); lanes 1 and 3: the noncancerous liver tissue; lanes 2 and 4: the HPA positive samples of cancer tissues both with a bright band at 585 bp.