
Figure 4.
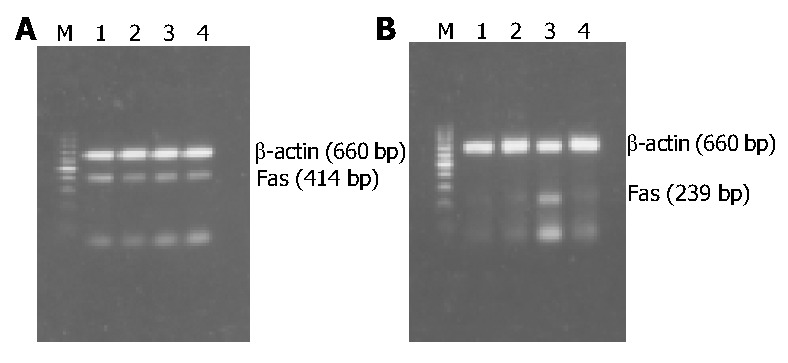
RT-PCR results of Fas/FasL mRNA expression in HSCs of different groups. A: RT-PCR results of Fas mRNA expression; B: RT-PCR results of FasL mRNA expression; M: 100 bp DNA ladder (upper to lower: 1000, 900, 800, 700, 600, 500, 400, 300, 200, and 100 bp); Lane 1: Normal group as control; Lane 2: PDGF treatment group; Lane 3: IL-10 treatment group; Lane 4: Combined PDGF and IL-10 treatment group.