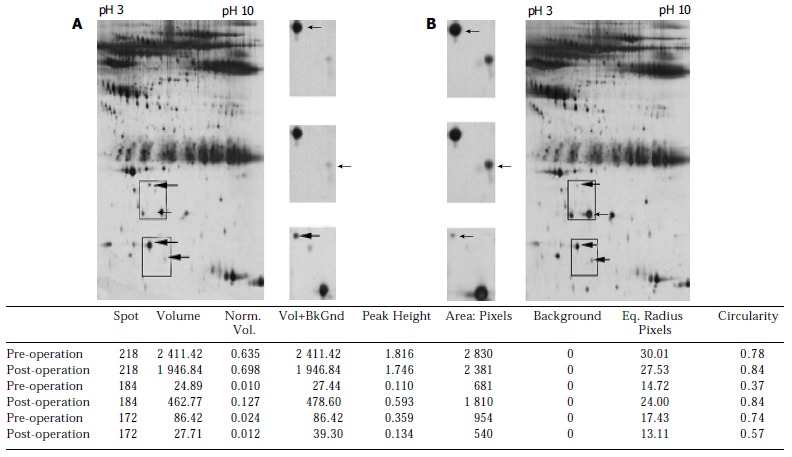
Figure 1.

Representative of two-dimensional electrophoresis profiles and three-matched protein spots (arrows) analysis of the sera from esophageal squamous cell carcinoma patients before (A) and after (B) operation with different acidity from pH3 to pH10. Norm: normalization, Vol: volume, BkGnd: background, Eq: equality.
