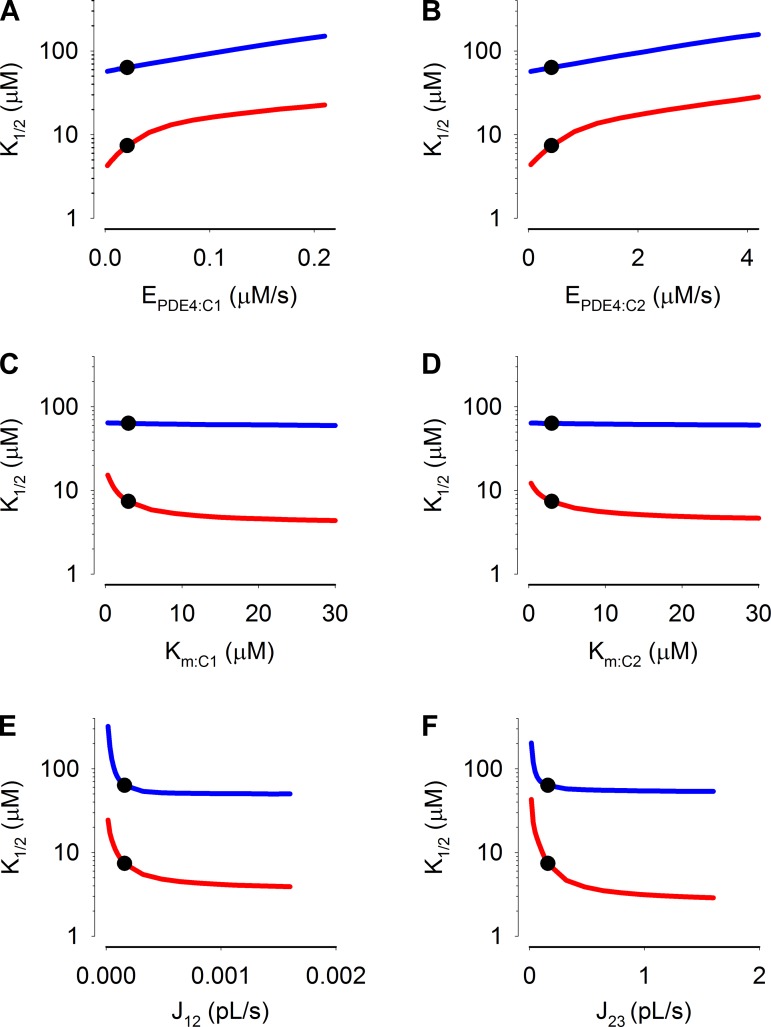
Fig. 11.
Estimated sensitivity of simulation results to changes in the maximal cAMP hydrolysis rates, Michaelis constants, and flux coefficients. Circles indicate values used in simulations. Lines indicate effect of changing indicated parameters on K1/2 of the simulated C460W/E583M (red) and WT CNG (blue) channel responses: EPDE4 in compartment 1 (A); EPDE4 in compartment 2 (B); Km of PDE4 in compartment 1 (C); Km of PDE4 in compartment 2 (D); the flux coefficient between compartments 1 and 2 (E); and the flux coefficients between compartments 2 and 3 (F).

