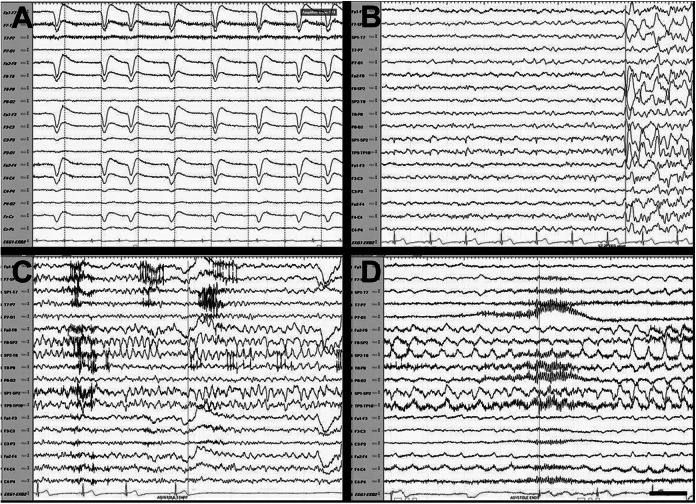
Figure 2.
Electroencephalogram (EEG). A, Interictal EEG showing a heart rate of 84 beats per minute. B, EEG immediately prior to seizure onset. C and D, Ictal onset in the right temporal lobe (SP2/FT10) showing sharply contoured, rhythmic delta then theta then delta waves. Asystole was seen 15 seconds after ictal onset with total duration of seizure lasting 63 seconds. The asystole lasted 29 seconds. Sensitivity 12 microvolts, low frequency at 1.6 Hz, and high frequency 70 Hz. Black bar represents 1 second.

