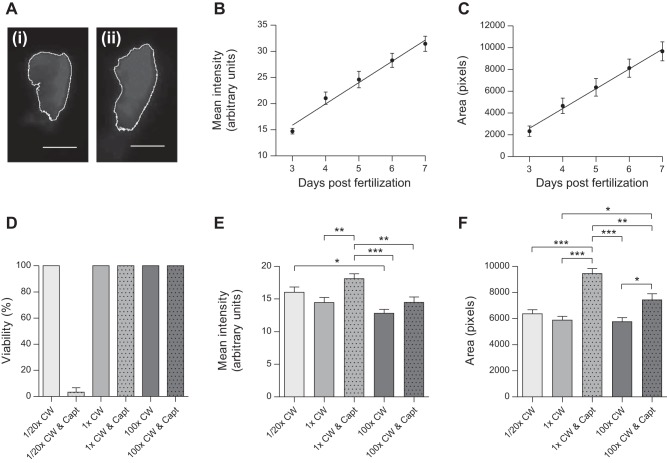
Fig. 3.
Evaluation of ren transgene expression at the AMA during development and after physiological challenge. A: representative grayscale ren-RFP images of Tg(ren:RFP, casper) used for mean RFP intensity and RFP area analysis. The white outline was based on the set color threshold for 1× conditioned water (CW; i) and 1× CW and captopril (Capt; ii). Scale bar = 20 μm. B and C: regression analysis (n = 9) showing linear increases in both mean ren-RFP intensity (R2 = 0.7096, P < 0.0001; B) and ren-RFP area (R2 = 0.5911, P < 0.0001; C) at the AMA from 3 to 7 dpf. D: 100% viability was seen across all salinity and captopril treatments except for dilute medium (1:20× CW) with the angiotensin-converting enzyme inhibitor captopril (0.1 mM), in which viability was just 3% by 96 hpf (n = 3, P <0.0001 by ANOVA). E: by 96 hpf, mean ren-RFP intensity was significantly affected by ambient salinity and captopril treatments (n = 31–35, P < 0.0001 by ANOVA). Post hoc analysis showed that 0.1 mM captopril in the control medium (1× CW) increased mean ren-RFP intensity; this effect was not significant in high salinity. Mean ren-RFP intensity was modulated by salinity alone, resulting in significantly lower RFP expression between low and high salinities. F: the area of ren-RFP expression was also significantly affected by captopril treatment (n = 31–35, P < 0.0001 by ANOVA) in both control medium and high salinity by 96 hpf. Salinity alone did not change the area of ren-RFP expression at the AMA.

