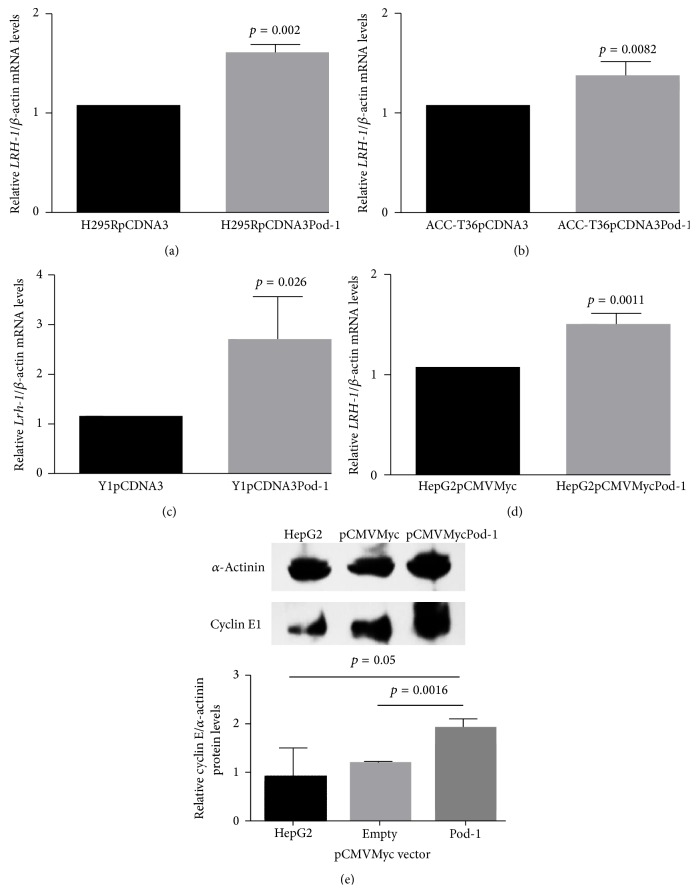
Figure 4.
Quantitative reverse transcription RT-PCR (qRT-PCR) of Lrh-1/LRH-1 mRNA levels and immunoblotting of Cyclin E1 protein levels. LRH-1/β-actin mRNA levels in H295R cells (a), ACC-T36 cells (b), Y1 cells (c), and HepG2 cells (d) transiently transfected with the empty vector (pCDNA3 or pCMVMyc) or with pCDNA3Pod-1 or pCMVMycPod-1; immunoblotting analysis of the relative Cyclin E1/α-Actinin protein levels in HepG2 cells (e) transiently transfected with the empty vector pCMVMyc or with pCMVMycPod-1. Total RNA samples and protein samples were prepared 48 h and 72 h after transfection, respectively. Differences were tested with paired samples t-tests. Values represent means ± standard deviations of 3 experiments.

