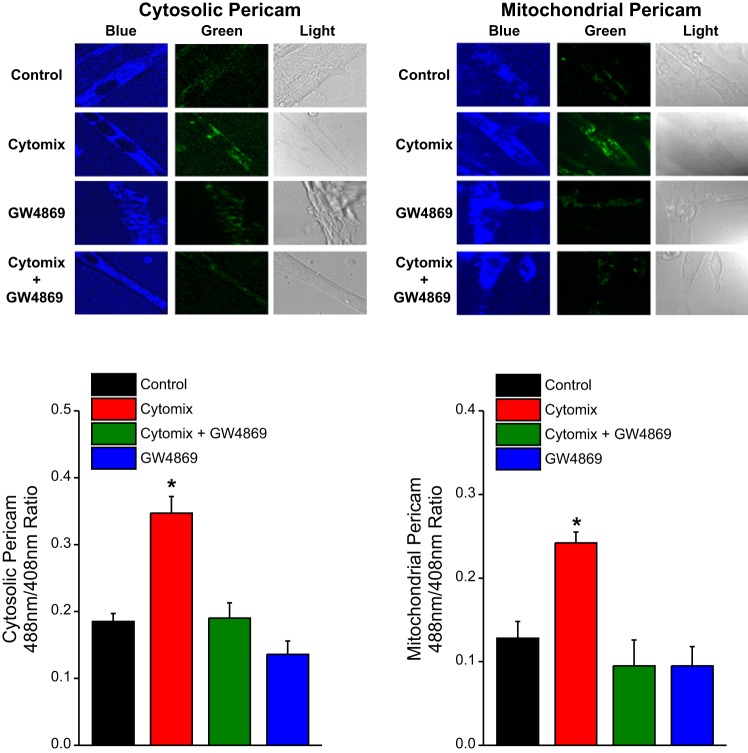
Fig. 2.
Cell calcium imaging studies. We stably transfected C2C12 cells with either a cytosolic pericam protein (left) or a mitochondrially targeted pericam protein (right); increases in calcium levels in these compartments cause an increase in the ratio of light emission intensity at 488 nm to the light emission intensity at 408 nm for pericam. Data from representative cell studies are shown at top and group mean data for the light emission 488 nm/408 nm intensity ratios are presented at bottom. The color coding of bars for group mean data is the same as in Fig. 1. The 488-nm emission is pseudo-colored green and the 408-nm emission is pseudo-colored blue. Cytomix increased both cytosolic and mitochondrial calcium concentrations (P < 0.001 and P < 0.002, respectively). Administration of GW4869 blocked these cytomix-induced responses.

