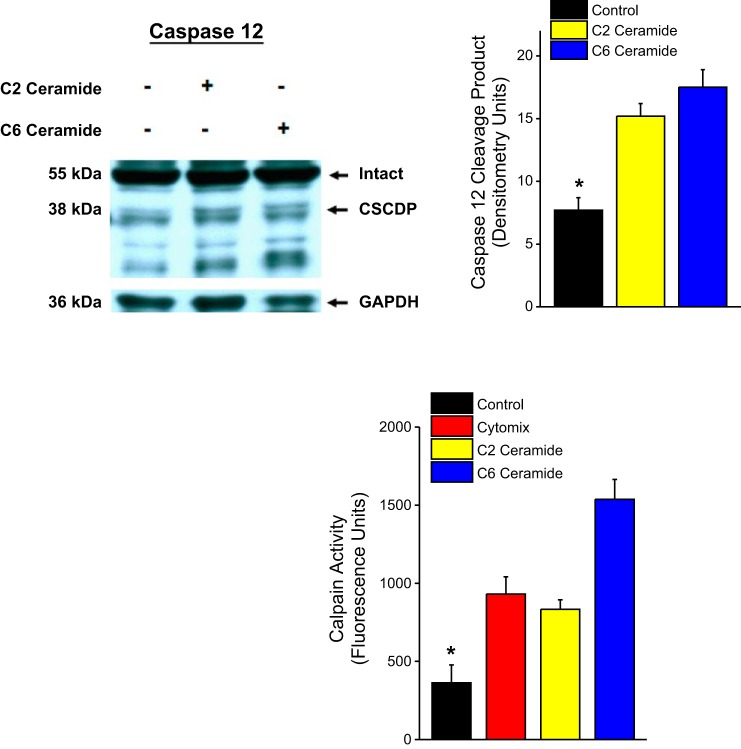
Fig. 6.
Effect of administration of C2 ceramide and C6 ceramide on CSCDP formation is shown at top, with a representative blot shown on the left and group mean densitometry data for CSCDP presented on the right. Bars represent mean data for control (black), C2 ceramide (yellow), and C6 ceramide (blue) groups. Bottom compares the effect of cytomix, C2 ceramide, and C6 ceramide on cell calpain activity assay levels. Bars represent mean data for control (black), cytomix (red), C2 ceramide (yellow), and C6 ceramide (blue) groups. Both C2 ceramide and C6 ceramide increased CSCDP formation relative to the control group (P < 0.001) and also directly measured calpain activity (P < 0.001).

