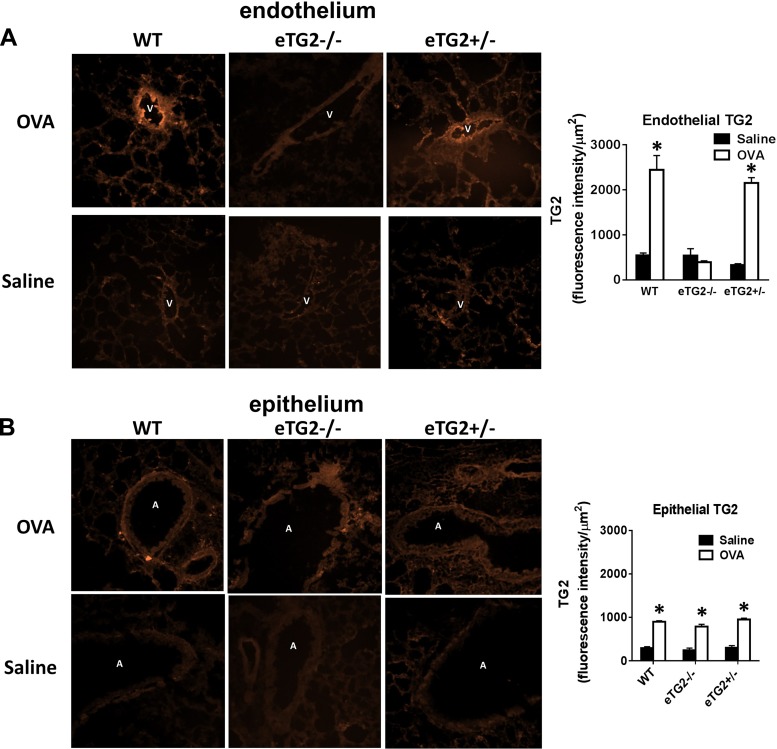
Fig. 3.
TG2 expression in lung tissue sections. Frozen lung tissue sections were immunolabeled with anti-TG2. A and B: TG2 in lung endothelium and epithelium of WT, eTG2−/−, and eTG2+/− mice. Left: representative micrographs of a high-power field. Right: relative intensity of anti-TG2 immunolabeling per area of endothelium or airway epithelium. For each mouse, the average relative intensity was obtained from 3–5 lung venule endothelium or airway epithelium (n = 6–8 mice per group). Values are means ± SE. V, vessel lumen; A, airway; OVA, ovalbumin. *P < 0.05 vs. saline control.

