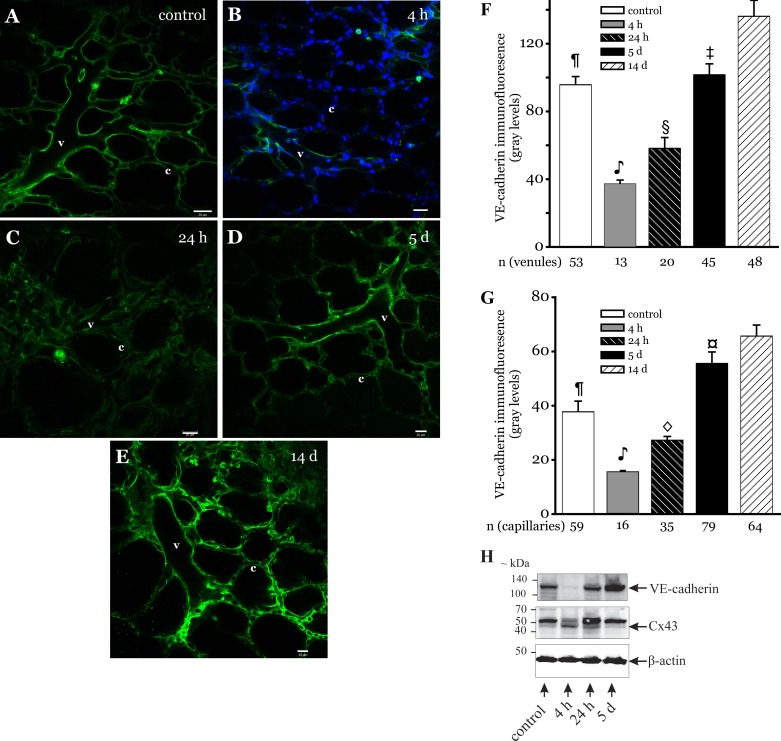
Fig. 4.
Vascular endothelial (VE)-cadherin expression in LPS-instilled lungs. A–E: confocal images show immunofluorescence of VE-cadherin (green) in microvessels of lungs from rats that were instilled with LPS (2 mg/ml at 1 μl/g body wt) and allowed to recover for the durations shown. Bar, 20 μm (n = 3 lungs each). F and G: bar graphs show VE-cadherin expression quantified along the walls of venules (F) and capillaries (G) in the image field. Nuclei appear in blue. Nuclear staining was omitted in some images to improve clarity of VE-cadherin staining. n = No. of vessels analyzed.  P < 0.05 compared with all groups except for the 24-h treatment group; §P < 0.01 compared with control, 5-day, and 14-day treatment groups; ¶P < 0.001 compared with 14-day treatment group; ‡P < 0.01 compared with 14-day treatment group; ◇P < 0.01 compared with 4-h, 5-day, and 14-day treatment groups; ¤P < 0.01 compared with control treatment group (3 lungs/treatment group). H: rats were instilled with LPS (2 mg/kg) and allowed to recover for 4 h, 24 h, and 5 days. Control rats were instilled with saline (volume 1 μl/g body wt). After the treatment duration, lungs were isolated and the peripheral regions of the lungs dissected and homogenized. The homogenized lung tissue was then prepared for immunoblot analysis of the indicated proteins, as outlined in materials and methods. Arrows point to β-actin, Cx43 (∼43 kDa), and VE-cadherin (∼132 kDa) bands. The Cx43 antibody used in this study also detected a nonspecific band at ∼52 kDa. Lung tissue from 1 rat/treatment period. Treatments and blots were repeated twice.

