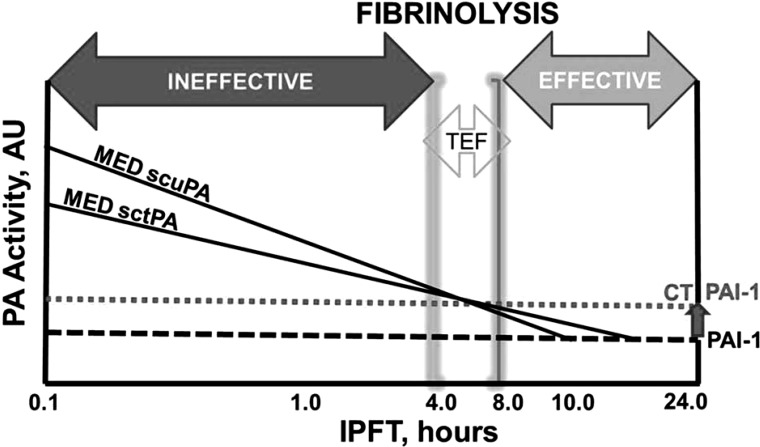
Fig. 10.
Intrapleural fibrinolysis during IPFT with a MED of sctPA or scuPA in TCN-induced pleural injury in rabbits. A double logarithmic plot of relative activity (PA and PAI-1, left and right, respectively) vs. time of IPFT illustrates 3 putative phases of intrapleural fibrinolysis: ineffective 0–4 h; effective 8–24 h; and the intermediate phase, the minimal time of effective fibrinolysis (TEF, 4–8 h). The dotted and dashed lines represent the relative levels of endogenous active PAI-1 expression with and without CT scans, respectively. The solid lines represent intrapleural inactivation of the MED of scuPA or sctPA. Intrapleural PA activity is suppressed and fibrinolysis stops as soon as endogenous PAI-1 inactivates fibrinolysin (intercepts of solid and dotted or dashed lines). As long as the time of fibrinolysis (time for positive intrapleural PA activity) equals or exceeds the TEF (4–8 h), IPFT is successful. Shortening the intrapleural half-life of PA activity, attributable to increased levels of PAI-1 (intercepts of solid and dotted lines), decreased IPFT efficacy.

