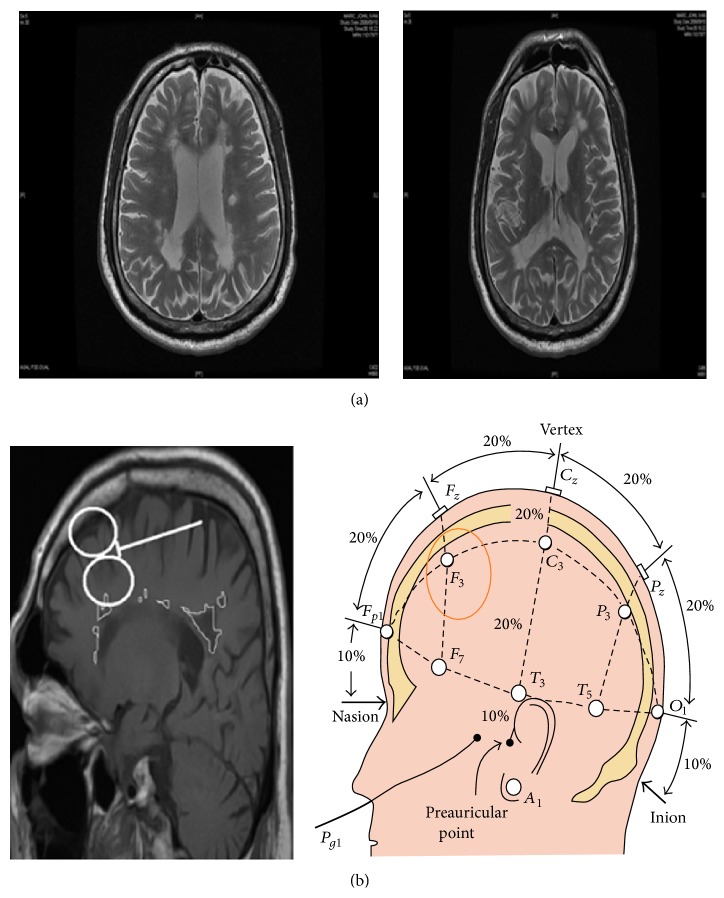
Figure 1.
(a) Patient's T 2 MRI transverse image showing several patches of white matter hyper-intensities representing demylinating lesions. (b) Patient's T 1 MRI sagittal image (on the left) showing approximate TMS coil location using the 10-20 international EEG lead localization system (on the right). White matter lesions are marked for demonstration on the T 1 sagittal image.

