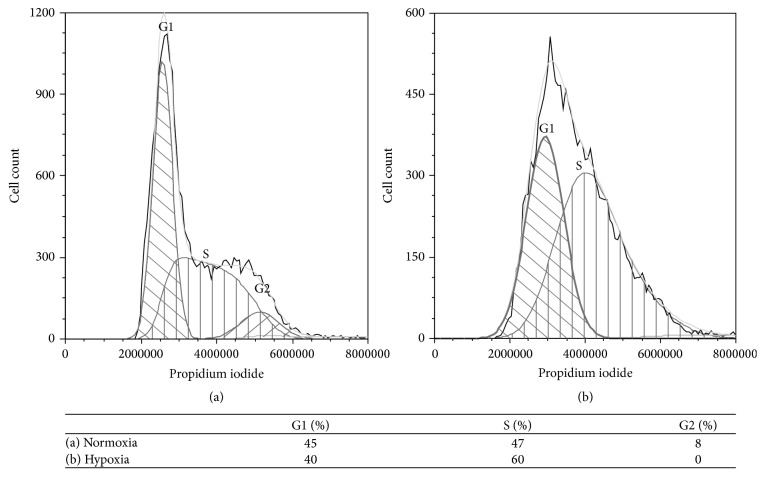
Figure 4.
Cell cycle analysis. HeLa cells grown under (a) normoxic and (b) hypoxic conditions (1% O2), stained with propidium iodide. The premitotic phases G1, S, and G2 are represented in the figure (calculated from the fluorescence intensity values; grey line). Cells grown under hypoxic conditions differ from those exposed to normoxia by showing an accumulation in G1 and a prolonged S phase.

