
Fig. 13.
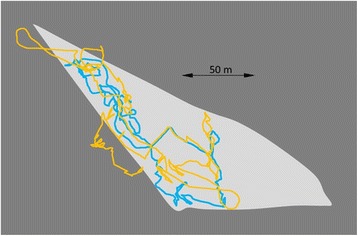
GPS-enabled dead-reckoned tracks (DD sampling rate 40 Hz, GPS sampling rate 0.1 Hz) from a domestic cow Bos taurus in an enclosed field (light grey area) over 2 h. The yellow track shows the calculated trajectory using all GPS points (at 20 s intervals) while the blue track shows the calculated trajectory omitting all unrealistic GPS points (based on speed and estimates outside the peripheral fence). Note that various elements of the GPS, such as the Kahlmann filter, may give highly credible loops within the track that do not correspond to the real trajectory of the animal (cf. yellow lines outside the field periphery)