Figure 2.

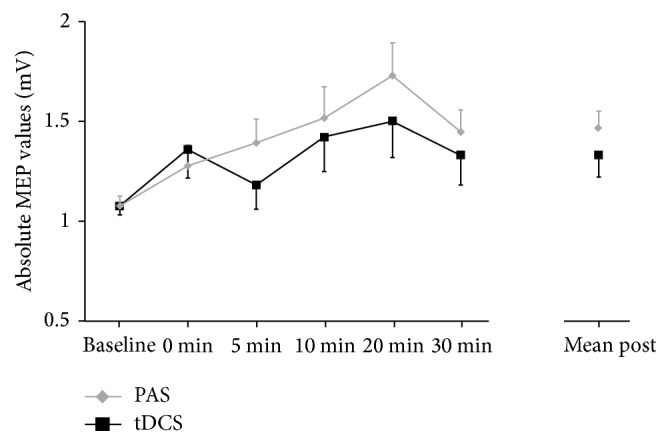
MEP values at baseline and all time points following anodal tDCS and PAS. MEP values are shown as untransformed values and scaled in mV and error bars representing the standard error of the mean.

MEP values at baseline and all time points following anodal tDCS and PAS. MEP values are shown as untransformed values and scaled in mV and error bars representing the standard error of the mean.