
Figure 6.
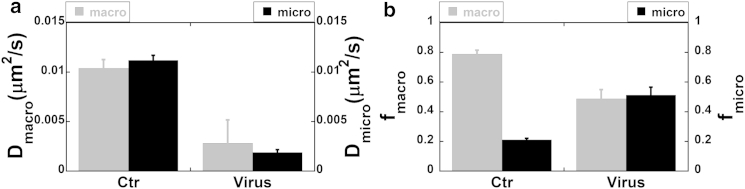
CFTR dynamics and distribution after acute viral infection. (a) Both the Dmacro and Dmicro of CFTR decreased significantly after the infection. (b) Although the unconfined population fraction, fmacro, decreased significantly postinfection (gray), the confined population fraction, fmicro, increased by twofold (black). This indicates recruitment of CFTR to confinement zones during infection. Error bars indicate the mean ± SE.