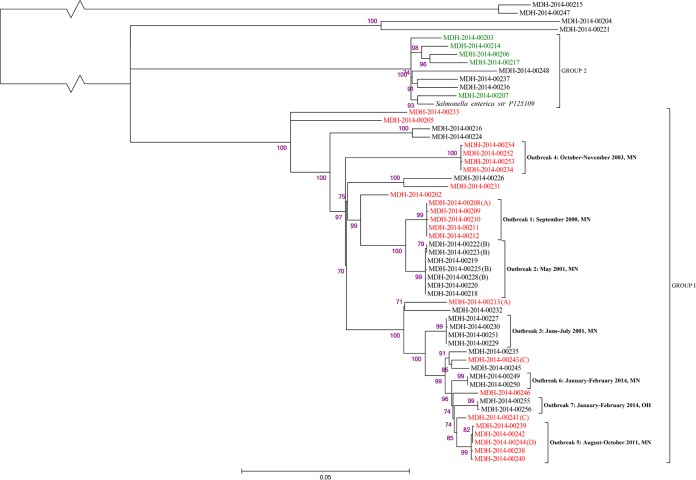
FIG 1.
Maximum-likelihood tree of S. Enteritidis isolates produced by SNP analysis, showing outbreak clusters and PFGE pattern distribution. Outbreak isolates are indicated by brackets and descriptions giving the outbreak time frame (month[s] and year) and state. Sporadic and suspect isolates constitute all isolates not indicated as belonging to an outbreak (except for MDH-2014-00208, which was a suspect isolate that clusters with outbreak isolates). Isolates with CDC PulseNet PFGE pattern JEGX01.0004 are colored red, and isolates with pattern JEGX01.0002 are colored green. Purple values at the bases of the nodes are approximate likelihood-ratio test values displayed as percentages. The scale bar indicates the average number of substitutions per site. The letters in parentheses at the end of some isolate labels indicate the following: (A) suspect isolate in same time frame and PFGE pattern as outbreak 1; (B) all isolates are from the same patient; (C) suspect isolate in the same time frame and PFGE pattern as outbreak 5; (D) environmental isolate from outbreak 5.

