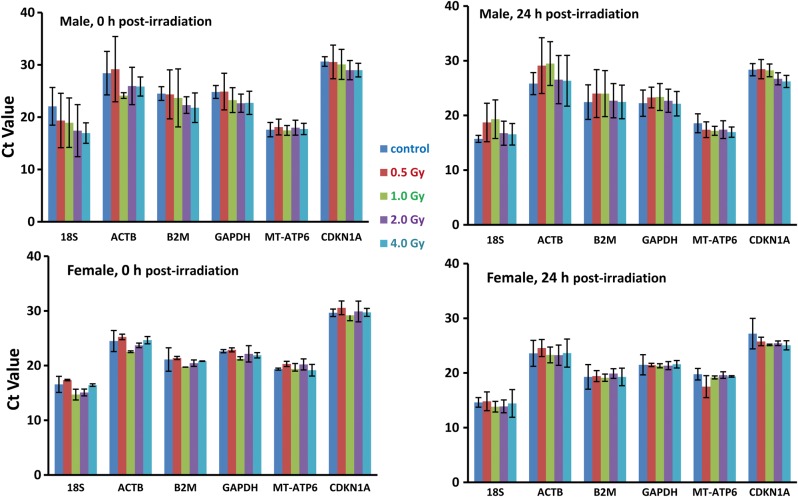
Fig. 1.
Ct values representing the expression levels of six housekeeping genes in human whole blood samples in the sham-exposed control and groups exposed to 0.5 Gy, 1 Gy, 2 Gy and 4 Gy doses of 60Co γ-radiation at 0 (left panels) and 24 h (right panels) post-irradiation in male (top panels) and female (bottom panels) blood samples. The bars represent the statistical means of the Ct values for different individuals within a group, and the SD represents the range of variation within a group. (Differences of P < 0.05 were considered statistically significant.)

