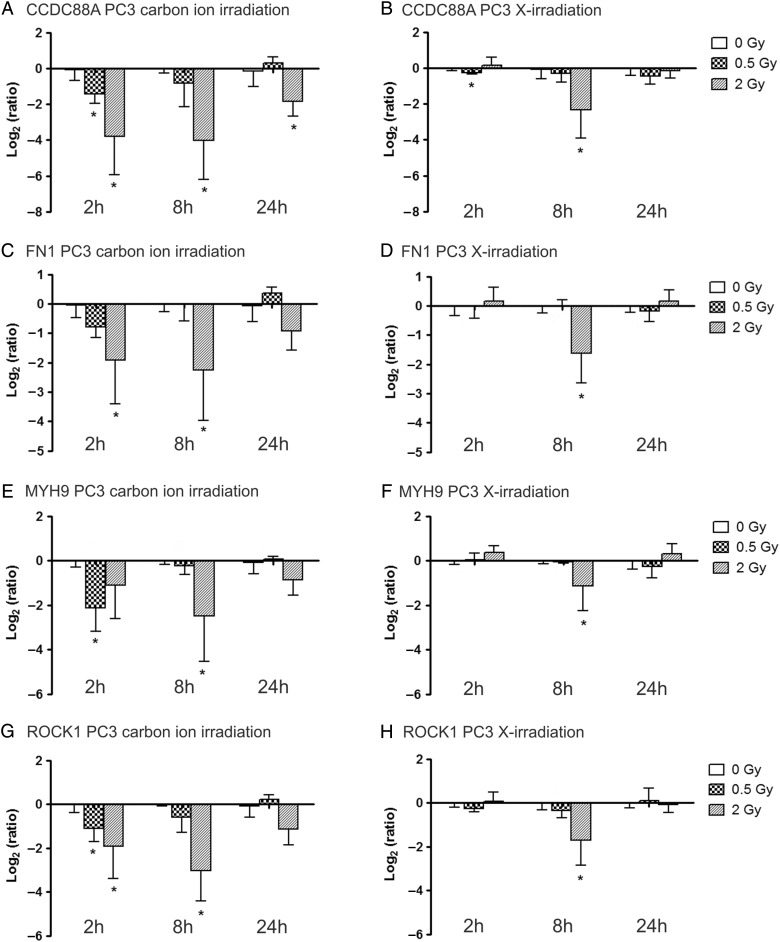
Fig. 2.
Relative gene expression changes of four motility genes in PC3 cells at 2 h, 8 h and 24 h after carbon ion (left column) and X-irradiation (right column). Log2(ratio) of the expression of CCDC88A after carbon ion (A) and X-irradiation (B), FN1 expression after carbon ion (C) and X-irradiation (D), MYH9 expression after carbon ion (E) and X-irradiation (F) and ROCK1 expression after carbon ion (G) and X-irradiation (H) is presented. *marks significantly altered gene expression compared to CTRL samples (P-value ≤ 0.05) based on one-tailed Mann Whitney tests.

