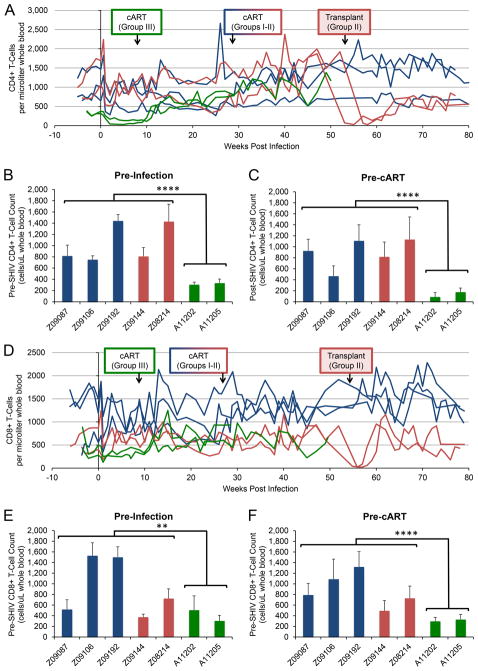
Figure 3. Peripheral blood T-cell counts are suppressed prior to SHIV challenge in post-transplant animals, but recover following initiation of cART.
Flow cytometry was used to longitudinally measure T-cell counts in peripheral blood from no transplant (blue), SHIV-transplant (red), and transplant-SHIV (green) animals. Arrows indicate time of cART initiation and autologous transplant, where applicable, for each group. A) CD4+ T-cell counts/μL over the course of SHIV infection in each animal. B) Average CD4+ T-cell counts over 4–6 weeks prior to SHIV challenge. C) Average CD4+ T- cell counts over 9–10 weeks post-challenge, prior to Group III animals initiating cART. D) CD8+ T-cell counts/μL were measured longitudinally as in A). E) Average CD8+ T-cell counts over 4–6 weeks prior to SHIV challenge. F) Average CD8+ T- cell counts over 9–10 weeks post-challenge, prior to Group III animals initiating cART. Error bars represent standard deviations between weekly measurements. Statistical significance between collective measurements from Groups I–II and Group III was measured by single-tailed Student’s t-test. ** represents p < 0.01, and **** represents p < 0.0001.

