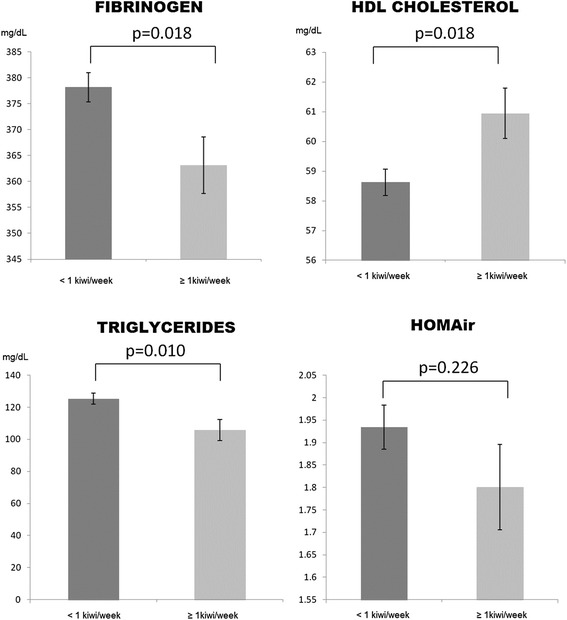
Fig. 1.

Fibrinogen, HDL-cholesterol, triglycerides and HOMAir according to kiwi consumption group. The bar graphs represent the marginal means and standard deviations adjusted for age; gender; physical activity (counts/min); total energy intake (kcal); total fruit consumption (gr/week), alcohol consumption (gr/week), body mass index and the presence of lipid-lowering drugs
