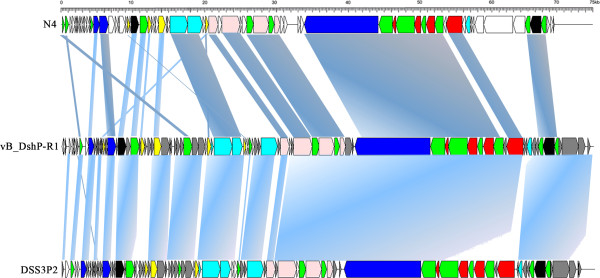
Figure 3.

Genome maps of Escherichia phage N4, Dinoroseobacter phage vB_DshP-R1 (reverse-complement) and Roseophage Silicibacter phage DSS3P2. ORFs are depicted by left or right-oriented arrows following the direction of transcription. Homologous ORFs are connected by shadowing, functional modules are indicated by color (red: structure gene; blue: transcription regulation; pink: DNA replication; cyan: lysis inhibition/host interactions; yellow: DNA metabolism; white: unknown or unique function; black: other function; green: homologous among these three phages; gray: homologous only between vB_DshP-R1 and DSS3P2).
