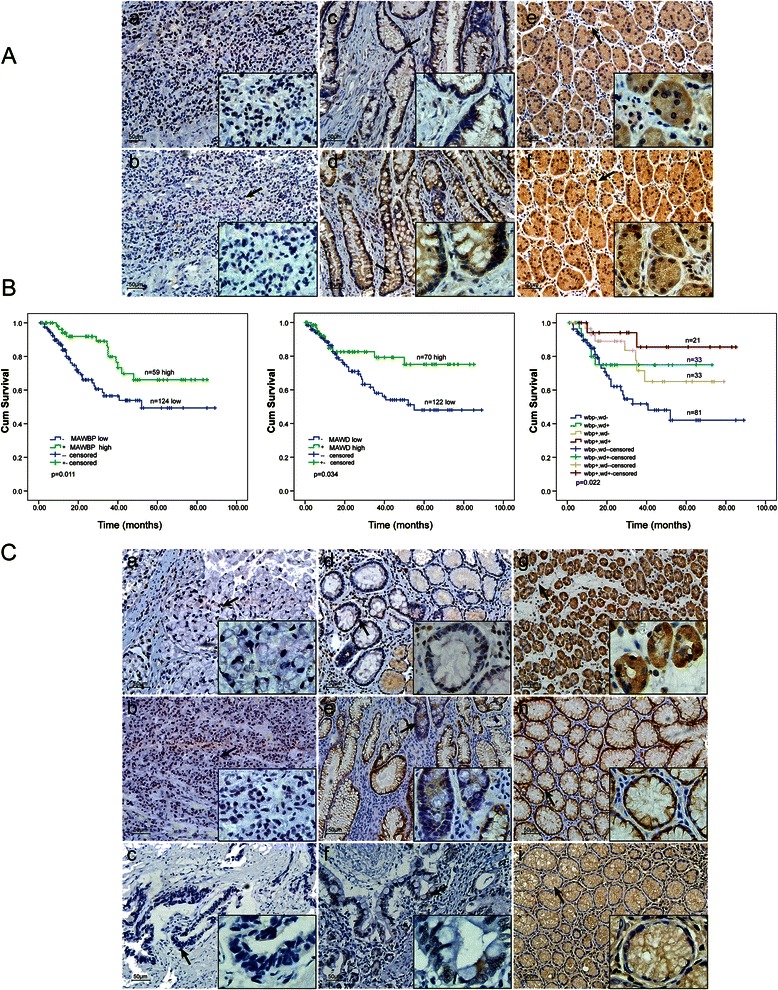
Fig. 1.

Comparison of MAWBP, MAWD, TGF-beta, E-cadherin, and PGC expression in GC and normal tissues by using IHC. (a) Comparison of MAWBP and MAWD expression in GC and normal tissues by means of TMA and IHC analysis (100×; 400× in the lower right corner). Weak MAWBP (a) and MAWD (b) protein staining in poorly differentiated carcinoma; expression of MAWBP (c) and MAWD (d) in intestinal metaplasia; strong positive staining of MAWBP (e) and MAWD (f) in normal tissues (P < 0.001). (b) Kaplan–Meier analysis of overall survival in GC patients expressing different levels of MAWBP and MAWD. (a) Green and blue lines represent the survival curves of patients expressing high and low levels of MAWBP (P < 0.05). (b) Green and blue lines represent the survival curves of patients expressing MAWD at high and low levels (P < 0.05). (c) Combined MAWBP and MAWD expression for analysis of overall survival; prognosis was better for patients who expressed high levels of MAWBP and MAWD than for patients who expressed the proteins at low levels (P < 0.05). (c) Comparison of TGF-beta, E-cadherin, and PGC expression in GC and normal tissues by using TMA and IHC analysis (100×; 400× in the lower right corner). Weak TGF-beta (a), E-cadherin (b), and PGC (c) protein staining in poorly differentiated carcinoma; staining for TGF-beta (d), E-cadherin (e), and PGC (f) in intestinal metaplasia; strong positive staining for TGF-beta (g), E-cadherin (h), and PGC (i) in normal tissues (P < 0.05)
