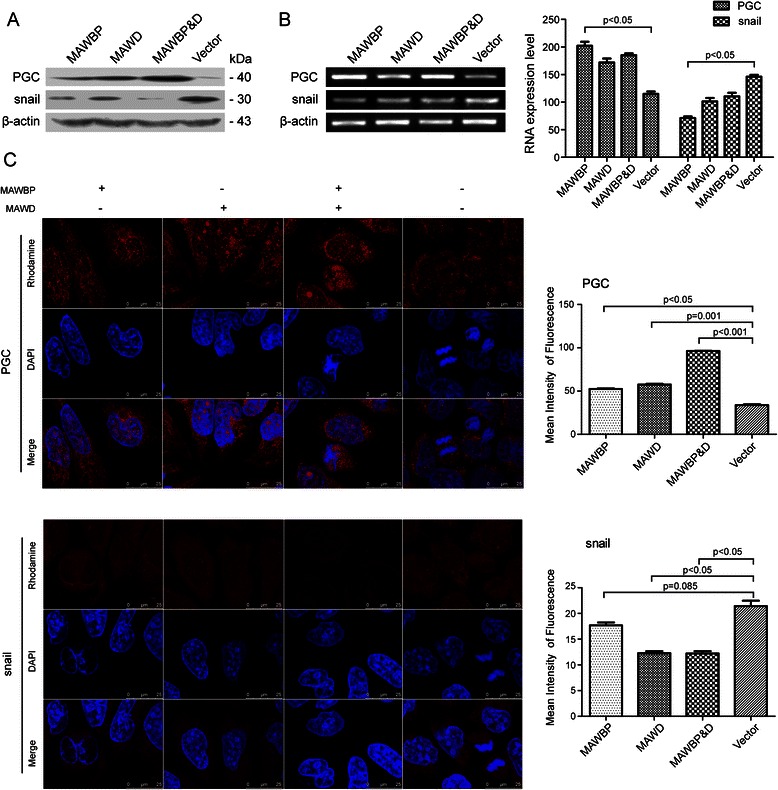
Fig. 4.

Expression of PGC and Snail in GC cells overexpressing MAWBP and MAWD. (a) PGC and Snail protein levels were measured through western blotting. PGC expression was highest in the MAWBP&D group (P < 0.001) and lowest in the Vector group, whereas Snail expression was weakest in the MAWBP&D group (P < 0.001). (b) PGC and Snail mRNA levels were estimated using semiquantitative RT-PCR. PGC expression was lowest in the Vector group, but N-cadherin expression was highest in the Vector group (P < 0.05). (c) PGC and Snail protein expression levels were analyzed using a confocal microscope. The mean fluorescence intensity shows that PGC expression was strongest in the MAWBP&D group (P < 0.001) and Snail expression was strongest in the Vector group (P < 0.05). Once again, the cells in the MAWBP&D group were morphologically well organized, but the Vector-group cells were disorganized
