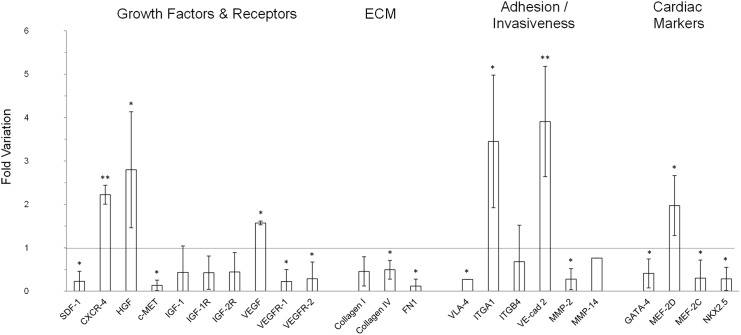
Fig 3. Gene expression of different growth factors, their receptors, ECM molecules, adhesion/invasiveness components and cardiac markers in spheroids and monolayer cultures.
Data from qPCR are expressed as fold variation of gene expression in spheroids normalized vs monolayers (line). Data are expressed as mean ± SD of at least three experiments. Significant difference of p≤0.05 is indicated as * and p≤0.001 is indicated as **.

