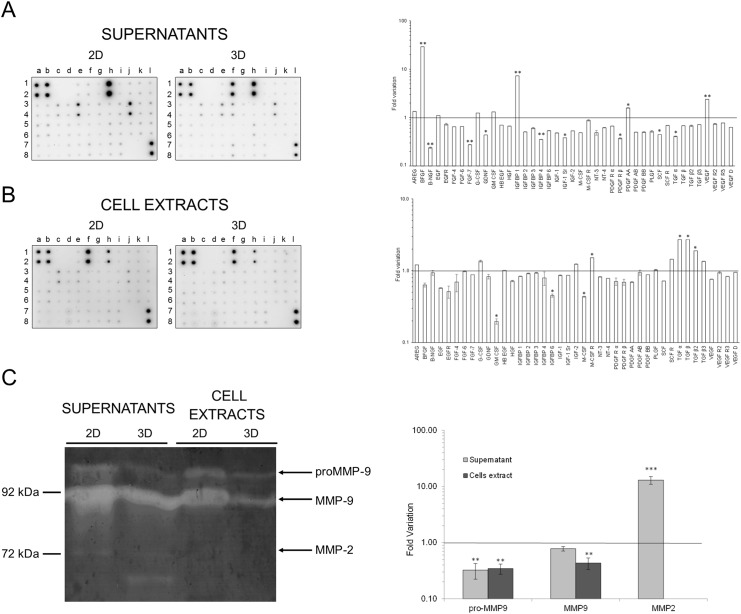
Fig 4. Protein expression of different growth factors, their receptors, and MMP activities.
(A) Antibody-array analysis of protein expression in supernatants (A) from 2D monolayers (left) and 3D spheroids (centre) and in cell extract (B) from 2D monolayers (left) and 3D spheroids (centre). Graphs on the right represent fold variation of protein levels in spheroids normalized vs monolayers (line). Data are expressed as mean ± SD of at least three experiments. Significant difference of p≤0.05 is indicated as * and p≤0.0001 is indicated as **. (C) Activities of MMP-2 and MMP-9 present in culture supernatants and cell extracts from monolayers 2D or 3D spheroids of hCPCs in a Gelatin-substrate zymography. Arrows indicate location of enzymatic activity corresponding to pro- and active forms of MMP-9 and MMP-2. Molecular weight markers (kDa) are shown on the left.

