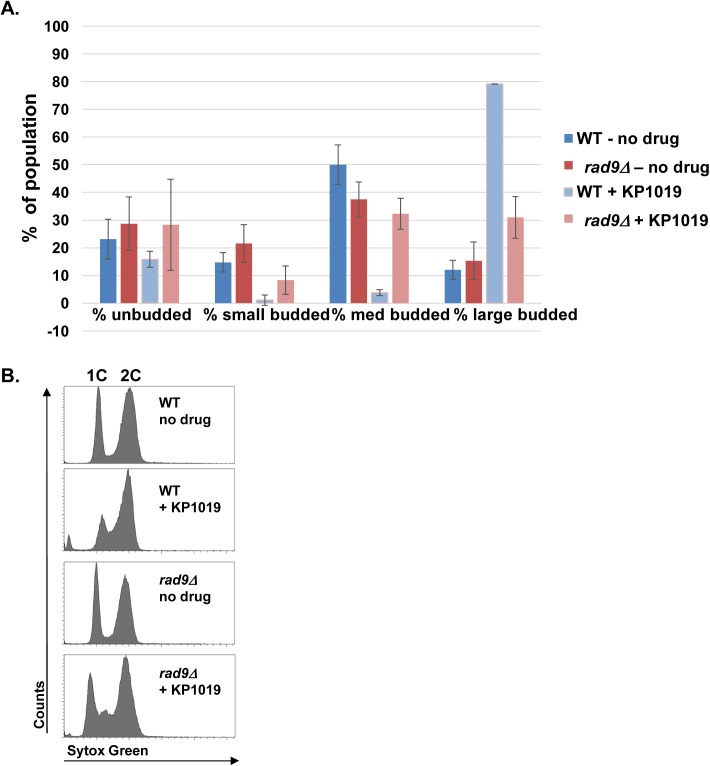
Fig 3. KP1019 induced cell cycle arrest requires RAD9.
A. MMY318-5A (WT) and rad9 deletion (rad9Δ) strains were assayed for budding index and DNA content. Early log phase cells were untreated (- KP1019) or treated for 3 hours with 80 mg/mL KP1019 (+ KP1019) and assayed for budding index or DNA content as described in Materials and Methods. A. Cells were fixed and scored for % of unbudded cells, small budded, medium budded and large budded cells within the population. Untreated samples are represented by blue (WT) and red (rad9Δ) bars, while treated samples are represented by light blue (WT) and light red (rad9Δ) bars. The average of three replicates is presented with 2XSE error bar. B. DNA content measured by flow cytometry using Sytox green based staining of nucleic acid as described in Materials and Methods. The x-axis represents increasing amounts of Sytox Green signal while the y-axis represents number of cells. Position of 1C and 2C DNA content peaks is indicated at the top of the Fig. panels. C. The average % cells in the population scored as G0/G1, S, and G2/M using ModFit analysis of samples exampled in (B). Untreated samples are represented by blue (WT) and red (rad9Δ) bars, while treated samples are represented by light blue (WT) and light red (rad9Δ) bars. The average of three replicates is presented with 2XSE error bars.

