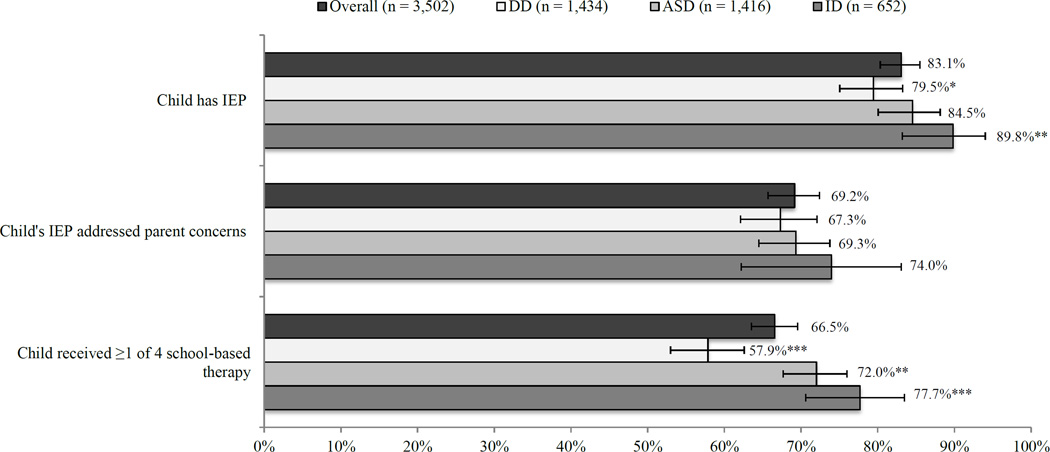
Figure 2.
Weighted Percentages with 95% Confidence Intervals of Educational Services Receipta
Among US Children Aged 6–17 Years, Overall and by Developmental Condition
***Indicates the proportion was significantly different from the proportion for the rest of the sample at the P < .001 level, **P < .01 level, or *P < .05 level.
aThe denominators for measures of having an IEP that addressed parent concerns about the child's development and education as well as receipt of ≥1 school-based therapy include all children in the study sample in order to show the proportion of children who could have potentially received such services regardless of whether they had an IEP.
Source: 2011 Survey of Pathways to Diagnosis and Services

