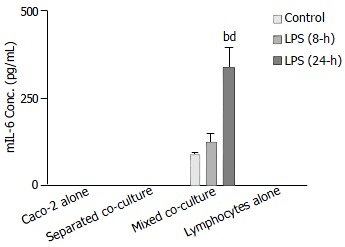
Figure 7.

Comparison of Shigella F2a-12 LPS-induced mIL-6 release from different culture groups by ELISA. Culture groups and Peyer’s patch lymphocytes (1 × 10⁶ cells) were treated with LPS for 8-h and 24-h. The values indicate mean ± SE; n = 5; bP < 0.01 (compared to mixed co-culture control) and dP < 0.01 (compared to the mixed LPS treatment for 8-h).
