
Figure 3.
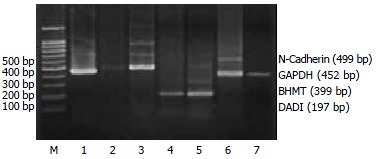
Electrophoresis analysis of RT-PCR products. Lane M: 100 bp DNA ladder; Lane 1: GAPDH; Lane 2, 3: N-Cadherin amplified from quiescent HSC and activated HSC mRNA respectively; Lane 3 shows increased expression of N-Cadherin in activated HSC compared with lane 2 in quiescent HSC. Lane 4, 5: DAD1 amplified from quiescent HSC and activated HSC mRNA respectively; Lane 5 shows increased expression of Annexin VI in activated HSC compared with lane 4 in quiescent HSC. Lane 6, 7: BHMT amplified from quiescent HSC and activated HSC mRNA respectively; Lane 7 shows decreased expression of BHMT in activated HSC compared with lane 6 in quiescent HSC.