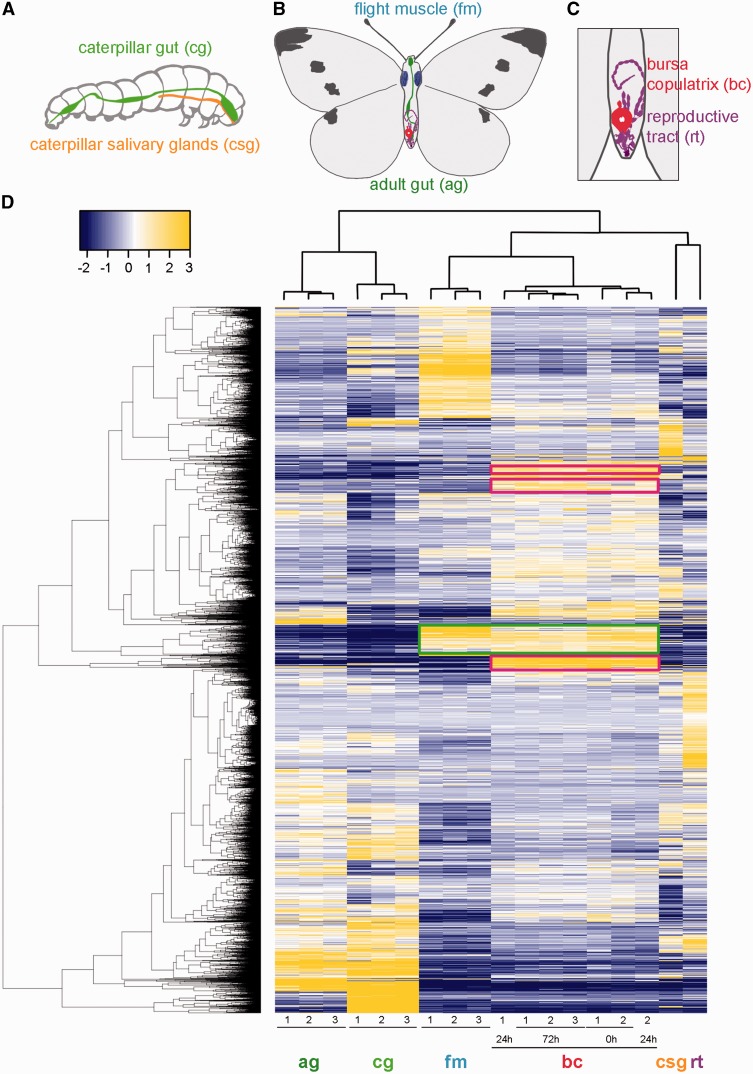
Fig. 2.
Differentially expressed genes in Pieris rapae. (A) Tissues sampled from P. rapae caterpillar. (B) Samples from P. rapae adult. (C) Detail of female P. rapae reproductive tract and bursa copulatrix. (D) Heatmap of log2-scale expression values for genes significantly differentially expressed among P. rapae tissues. Hierarchical clustering of genes and replicates was based on Euclidean distance. A false discovery rate cutoff (FDR = 0.001) and a minimal 4-fold change were applied to select the genes represented in the heatmap. Cells are colorized according to level of expression (blue = low, yellow = high). Numbers at bottom indicate biological replicates. Each tissue exhibits a unique expression pattern, but there are notable correlations between adult and caterpillar guts (ag, cg) and between the flight muscle and the bursa (fm, bc, green box). Moreover, some genes appear to be highly expressed only in the bursa copulatrix (magenta boxes).

