Fig. 3.
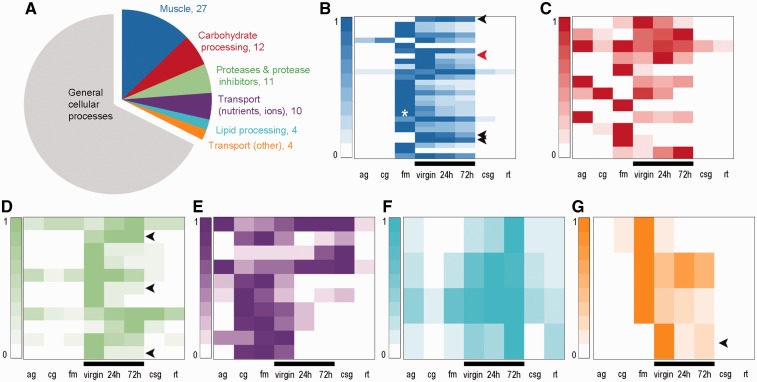
The bursa copulatrix expresses genes with digestive functions that are coexpressed in other tissues. (A) Functional annotation of 210 of the 315 most expressed genes in the bursa copulatrix and their expression depending on their functional categories. Colored slices of the pie chart are functional categories relevant to the bursa function. (B–G) Each heatmap shows the expression of the genes (rows) belonging to each biological function emphasized in the pie chart. Expression levels for each gene are relative to the maximum expression of that gene in a specific tissue cells are colorized according to each relative level of expression (0 = low relative expression, 1 = high relative expression). (B) Muscle, white star represents Troponin T (comp90911_c0) expression in flight muscle, red arrow represents bursa-specific troponin C (comp90487_c0). (C), Carbohydrate processing; (D) proteases and proteases inhibitors; (E) transport (nutrients, ions); (F) lipid processing; (G) transport (other). ag, Adult gut; cg, caterpillar gut; fm, flight muscle; virgin, virgin bursa copulatrix; 24 h, bursa copulatrix (24 h after mating); 72 h, bursa copulatrix (72 h after mating); csg, caterpillar salivary glands; rt, female reproductive tract. Black bars emphasize bursa samples. Black arrows emphasize genes highly expressed only in the bursa.

