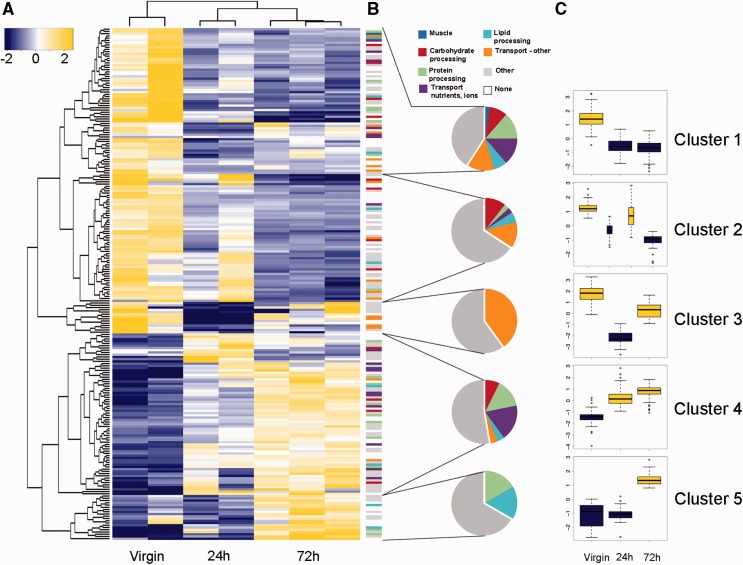
Fig. 6.
Spermatophore digestion in the bursa copulatrix is a transcriptionally dynamic process. (A) Heatmap of log2-scale expression values for genes significantly differentially expressed in the bursa copulatrix depending on the timing after mating (virgin, 24 and 72 h). Hierarchical clustering of genes and replicates was based on Euclidean distance. A q-value cutoff for the false discovery rate (FDR = 0.001) and a minimal fold change of 4-fold were applied to select the genes represented in the heatmap. Cells are colorized according to level of expression (blue = low, yellow = high). (B) Functional categories of genes differentially expressed in the bursa for each mating time point (virgin, 24 and 72 h). Each color represents a particular molecular function. Pie charts summarize the proportion of genes belonging to each category. (C) Variation in expression of differentially expressed genes during mating (log2-fold change). Means are represented for each mating time point, except for the 24 h time point for cluster 2. Boxplots are colorized according to level of expression as in A (blue = low, yellow = high).

