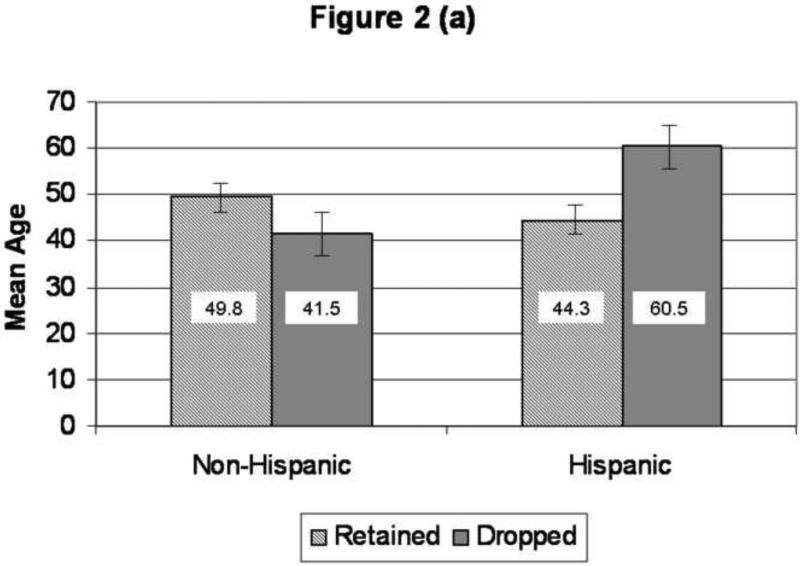
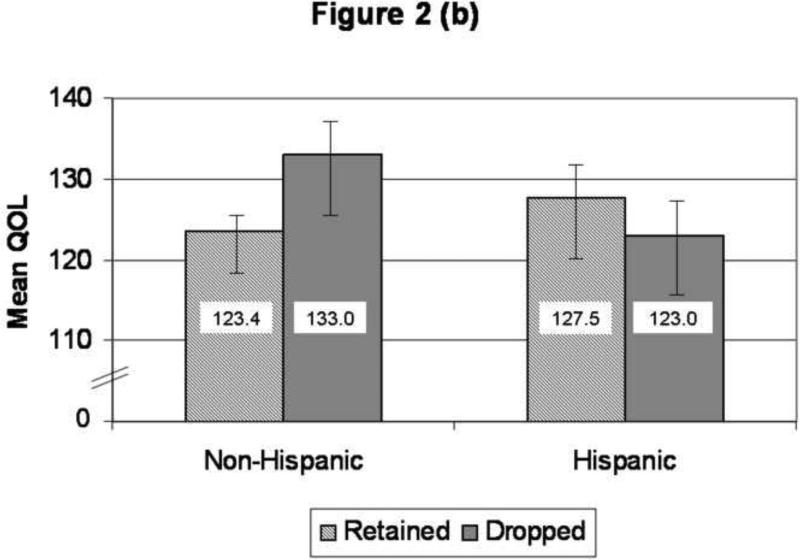
Figure 2.
Age and Baseline Quality of Life by Ethnicity and Study Retention.
Panel A, graph depicting mean age for non-Hispanic and Hispanic women who were retained in and dropped from the study. Mean values are included on each column and error bars depict standard error values. Significant differences in age was detected for Hispanic women (p=0.008) whereas non-Hispanic women who dropped were younger than those retained (p=0.19; p=0.01 for interaction between ethnicity and attrition). Panel B, graph depicting mean baseline quality of life as measured by the FACT-Cx for non-Hispanic and Hispanic women who were retained in and dropped from the study. Mean values are included on each column and error bars depict standard error values. Hispanic women who dropped out had lower QOL compared to those retained (p=0.60) whereas non-Hispanic women who dropped had higher QOL) compared to those who completed the study (p=0.23; p=0.27 for interaction).


