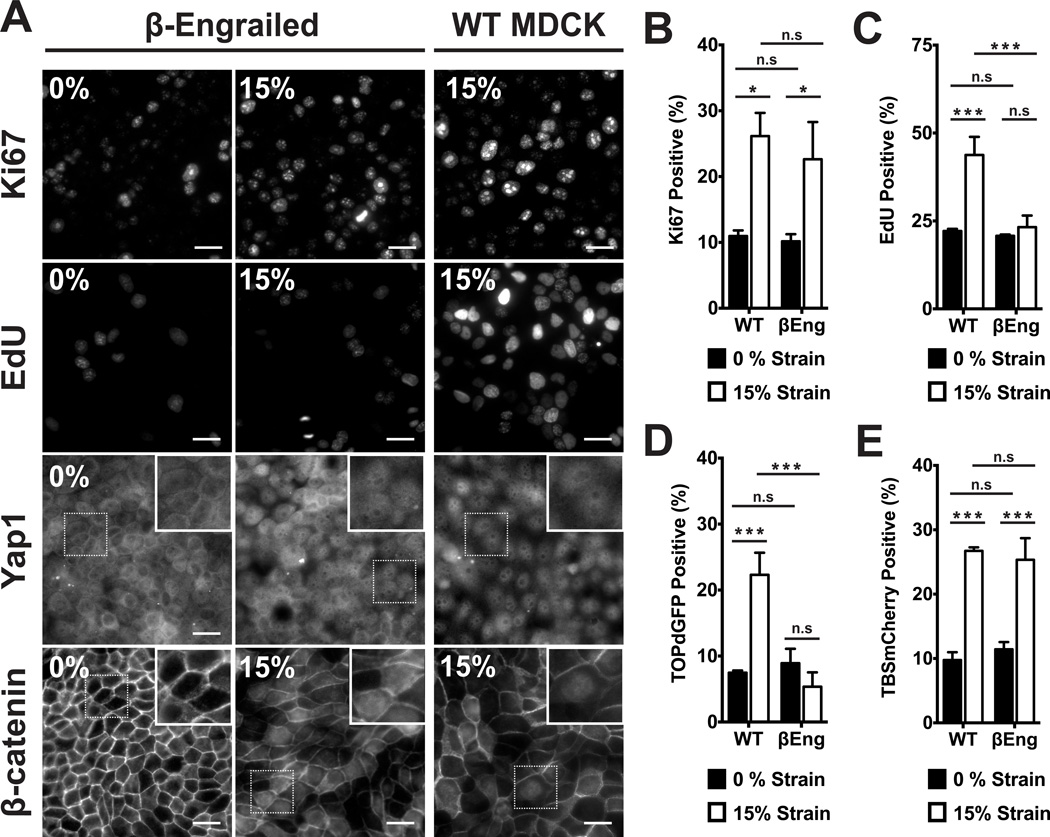
Figure 3.
β-catenin transcriptional activity was required for cell cycle progression through G1 into S phase after mechanical strain. (A) Distributions of Yap1 4hrs after no strain or 15% strain, Ki67 and β-catenin after 8hrs, and EdU incorporation after 24hrs in control (WT) and βEng-expressing MDCK monolayers. Insets show higher magnification of the region outlined by a dotted line. Quantification of Ki67 (B) and TOPdGFP (D) 8hrs after no strain or 15% strain, EdU (C) after 24hrs, and TBSmCherry (E) after 4hrs in control (WT) and βEng MDCK cells. Scale bars: 25 µm. All quantifications (see Supplementary Information) were from at least 3 independent experiments with 2 replicate monolayers per experiment (Table S1). Quantifications were mean +/− SEM; unpaired t-test p values < 0.05 (*), p values < 0.01(**), p values <0.001 (***).

