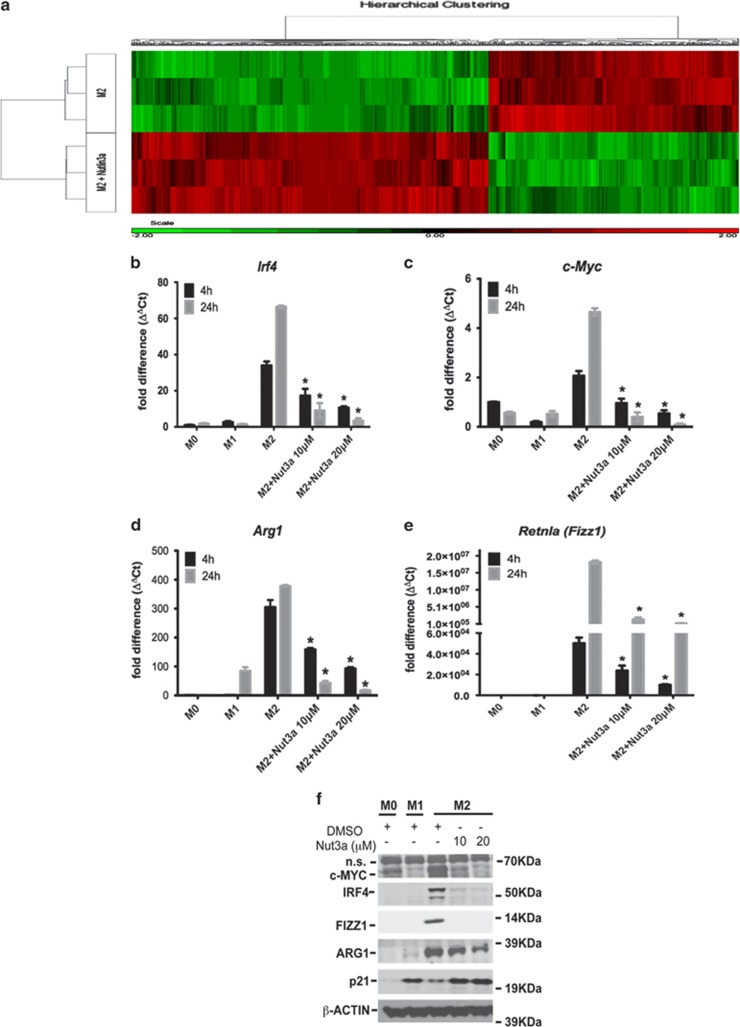
Figure 2.
Effect of nutlin (Nut)-3a induced p53 activation on gene expression in polarized macrophages. (a) Heatmap of differentially expressed genes between M2-polarized macrophages in the presence or absence of nutlin-3a (10 μM). Results show higher (red) or lower (green) expression after drug treatment. Color scale is shown at the bottom, whereby log2 expression values were scaled to range from −2 to +2. Data are from a single experiment and are representative of three independent samples. (b–e) Expression of Irf4 (b), c-Myc (c), Arg1 (d) and Retnla (Fizz1; e) in untreated (M0) and M1- and M2-polarized macrophages determined at either 4 or 24 h of polarization. In some experiments, M2 macrophages were treated with nutlin-3a (10 or 20 μM). Data show fold change in gene expression by RT-qPCR (ΔΔCt method), and are mean±S.D., n=6 and are representative of three independent experiments. *P<0.05 cf. M2. (f) Expression of c-MYC, IRF4, FIZZ1, ARG1 and p21 proteins in untreated (M0) and polarized (M1 and M2) macrophages as assessed by western blotting and determined at 24 h of polarization. In some experiments, M2 macrophages were treated with either DMSO or nutlin-3a (10 or 20 μM). Results are from an individual experiment with β-ACTIN as a loading control and are representative of three independent experiments. See also Supplementary Figure S1

