Figure 4.
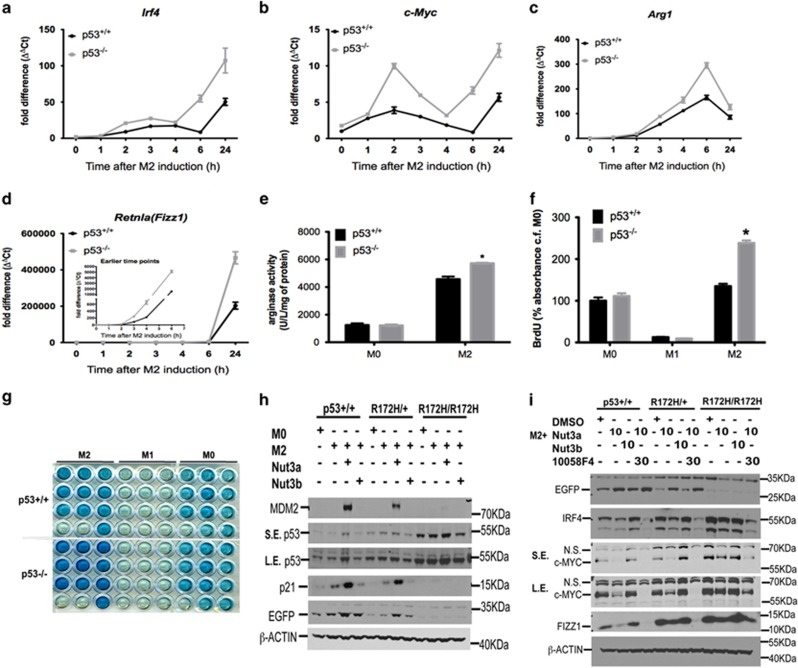
Effect of endogenous p53 activation on M2 gene expression. (a–d) Time-dependent expression of M2 marker genes Irf4 (a), c-Myc (b), Arg1 (c) and Retnla (Fizz1; d) in M2-polarized macrophages derived from p53+/+ and p53−/− mice. Data show fold change in gene expression by RT-qPCR (ΔΔCt method), and are mean±S.D., n=6 and are representative of three independent experiments. (e) Arginase catalytic activity determined in M0- or M2-polarized macrophages from p53+/+ and p53−/− mice at 24 h of polarization. Data show enzyme activity expressed as U/l/mg protein and are mean±S.E.M. of three independent experiments. *P<0.05 cf. p53+/+. (f and g) Measurement of cell proliferation in M0, M1 and M2 macrophages at 24 h from p53+/+ and p53−/− mice as determined by 5-bromo-2-deoxyuridine (BrdU) pulsing. Results are expressed as % absorbance cf. M0 control in p53+/+ cells after subtraction of results for medium-only controls (f), and show mean±S.E.M., n=3. *P<0.05 cf. p53+/+ cells. Representative photograph indicating end point colorimetric change of cells is shown in (g). (h) Western blot data showing p53, p21, MDM2 and EGFP protein expression in M0- or M2-polarized macrophages prepared from p53+/+, p53R172H/+ and p53R172H/R172H mice crossed with p53 reporter strain in the presence of either nutlin (Nut)-3a (10 μM) or nutlin-3b (10 μM) for 24 h. β-ACTIN was used as a loading control. SE, short exposure; LE, long exposure. Results are representative of three independent experiments. (i) Western blot data showing EGFP, IRF4, c-MYC and FIZZ1 protein expression in M2-polarized macrophages prepared from p53+/+, p53R172H/+ and p53R172H/R172H mice crossed with p53 reporter strain in the presence of either nutlin-3a, nutlin-3b (both 10 μM) or a combination of nutlin-3a (10 μM) and the c-MYC inhibitor, 10058F4 (30 μM), for 24 h. Loading control was β-ACTIN. Results are representative of two independent experiments. NS, non specific. NS, not significant: See also Supplementary Figures S3 and S4

