Figure 7.
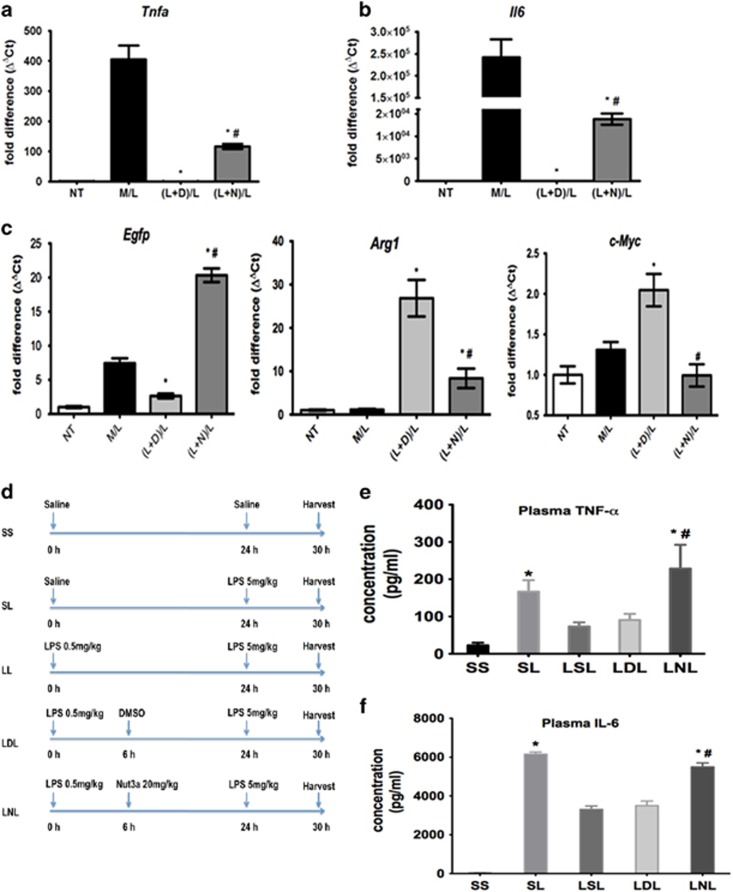
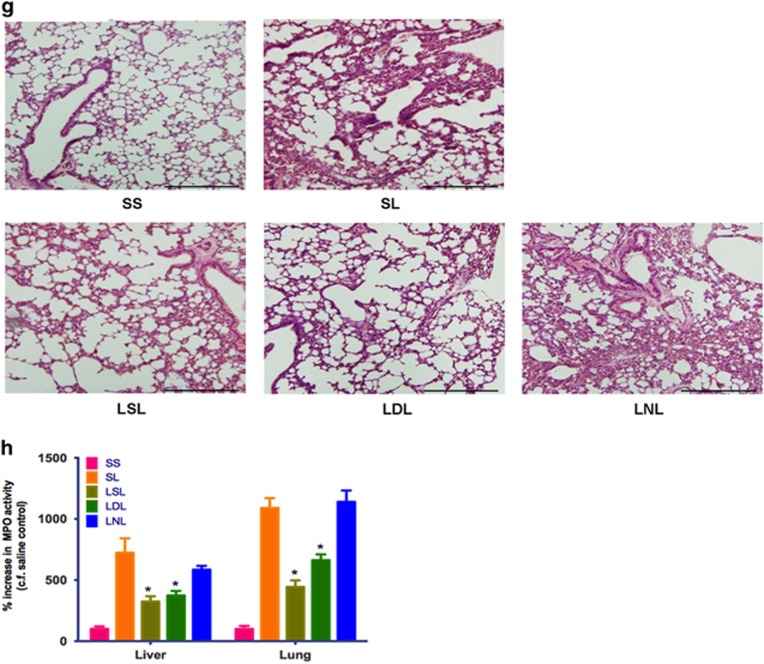
Effect of p53 activation on M2-mediated changes in LPS tolerance in vitro and in vivo. (a–c) Effect of nutlin-3a on LPS-induced tolerance in vitro. Cells were either left untreated (NT) or incubated in medium alone and then treated with LPS (100 ng/ml; M/L). For tolerance experiments, cells were first incubated in medium containing LPS (100 ng/ml) and DMSO vehicle [(L+D)/L] or nutlin-3a (10 μM; (L+N)/L) and then challenged with LPS (100 ng/ml) again 24 h later. Results show expression of Tnfa (a), Il6 (b), Egfp, Arg1 and c-Myc (c) and show fold change in gene expression by RT-qPCR (ΔΔCt method), and are mean±S.D., n=6–8 and are representative of three independent experiments. *P<0.05 (cf. M/L) and #P<0.05 (cf. (L+D)/L). (d) Scheme showing procedure used to evaluate induction of LPS tolerance in vivo. (e and f) Effect of nutlin-3a (20 mg/kg, intraperitoneally LNL) or DMSO-containing vehicle (LDL) on plasma TNFα (e) and IL6 (f) in LPS-tolerant animals in vivo. Data show mean±S.E.M., n=5–15. *P<0.05 (cf. SS) and #P<0.05 (cf. LDL). (g) Hematoxylin and eosin sections from lungs of saline-injected control (SS), LPS-challenged (SL), LPS-tolerant (LSL) and LPS-tolerant mice administered either nutlin-3a (20 mg/kg, intraperitoneally, LNL) or DMSO-containing vehicle (LDL). Results are representative of three independent experiments using at least three mice per group. Magnification, × 100. Scale bar shows 100 μm. (h) Effect of nutlin-3a (20 mg/kg, intraperitoneally) on lung and liver MPO activity from saline-injected control control (SS), LPS-treated (SL) and LPS- tolerant (LSL) mice administered either nutlin-3 (20 mg/kg, intraperitoneally, LNL) or DMSO vehicle (LDL). Data show mean±S.E.M., n=8–12. *P<0.05, cf. SL. See also Supplementary Figures S6 and S7


