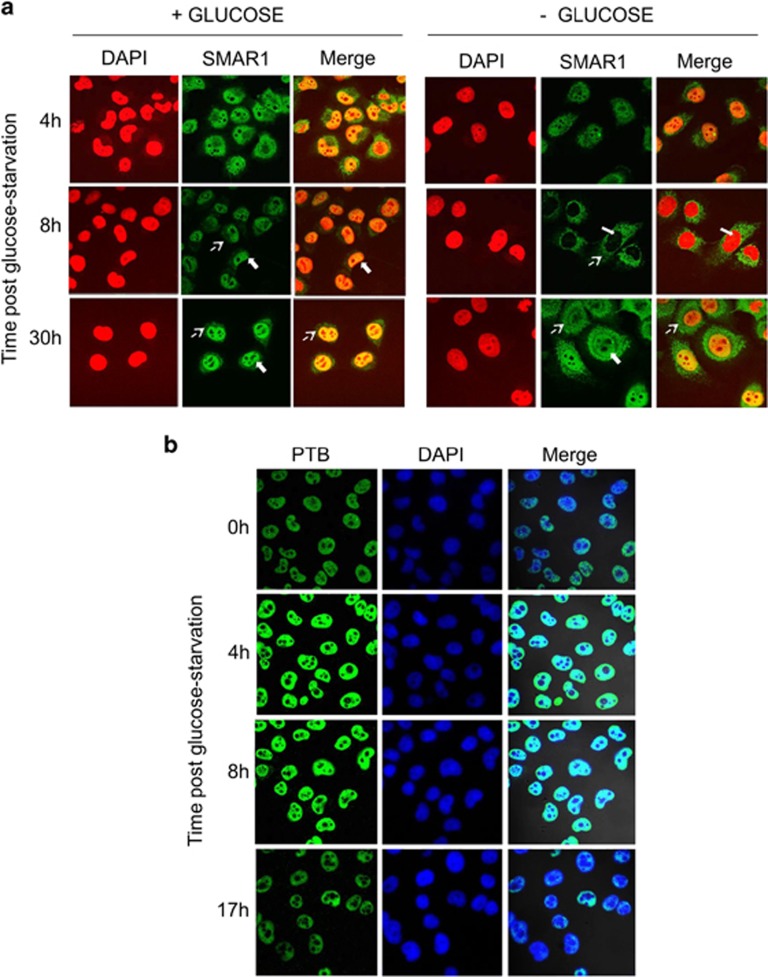
Figure 3.
Localization of SMAR1 and PTB after glucose deprivation (a) Intracellular redistribution of SMAR1 on glucose deprivation. Anti-SMAR1 antibody was used in indirect immunofluorescence assay on asynchronous H1299 cells starved of glucose for 4, 8 and 30 h and compared to unstarved cells at same time points. Dashed and solid arrows indicate cytoplasmic and nuclear localization of SMAR1, respectively. Fluorescently labeled secondary antibody was used and visualized by Zeiss LSM microscope at x60 objective. SMAR1 is shown in green and DAPI (nucleus) in red, whereas SMAR1 and DAPI merge is shown in yellow. (b) PTB does not relocalize to the cytoplasm on glucose deprivation. Anti-PTB antibody was used in indirect immunofluorescence assay on asynchronous H1299 cells starved of glucose for the indicated time points. Fluorescently labeled secondary antibody was used and visualized by Zeiss LSM microscope at x60 objective. PTB is shown in green and DAPI (nucleus) in blue, whereas PTB and DAPI merge is shown in cyan

