Figure 6.
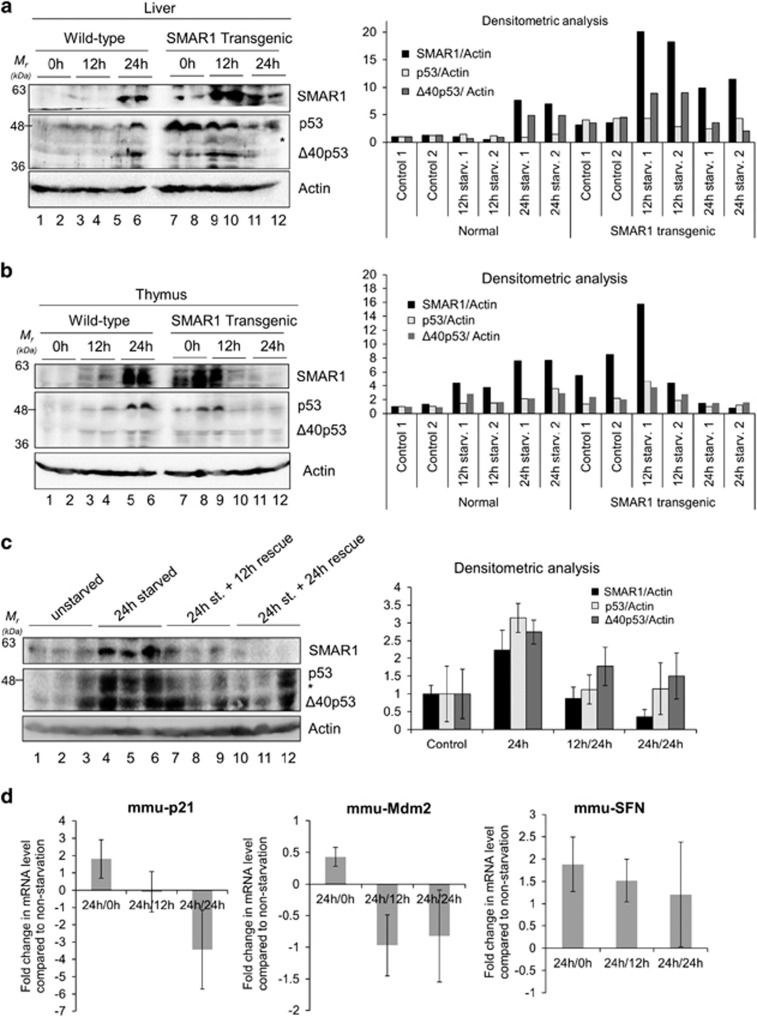
Starvation induces levels of SMAR1, p53 and Δ40p53 in vivo and this effect is reversible on withdrawal of starvation. Western blot of tissue extracts of liver (a) or thymus (b) from wild-type and SMAR1 transgenic mice at 0, 12 and 24 h of starvation, in duplicates, probed for SMAR1 (upper panel), p53 and Δ40p53 (middle panel) and actin (lower panel). Graphs show lane-wise densitometric analysis of SMAR1, p53 and Δ40p53 levels normalized to actin, n=4. ‘*' represents non-specific band. (c) Rescue experiment on starvation withdrawal for 12 and 24 h following 24 h of dietary starvation. Western blot of tissue extracts of the liver from wild-type mice probed for SMAR1 (upper panel), p53 and Δ40p53 (middle panel) and actin (lower panel). Graphs show lane-wise densitometric analysis of SMAR1, p53 and Δ40p53 levels normalized to actin, n=3. ‘*' represents non-specific band. (d) Quantitative PCR for levels of p53-target mRNAs p21/Cip1 (CDK-interacting protein1), SFN (stratifin alias 14-3-3σ) and Mdm2 (murine double minute 2) in wild-type mice liver, starved of glucose for 12 h (12 h) and then rescued by starvation withdrawal for 12 h (12 h/12 h) and 24 h (12 h/24 h). Results represented as fold change in mRNA levels compared to liver from non-starved mice, n=3. mmu: Mus musculus

