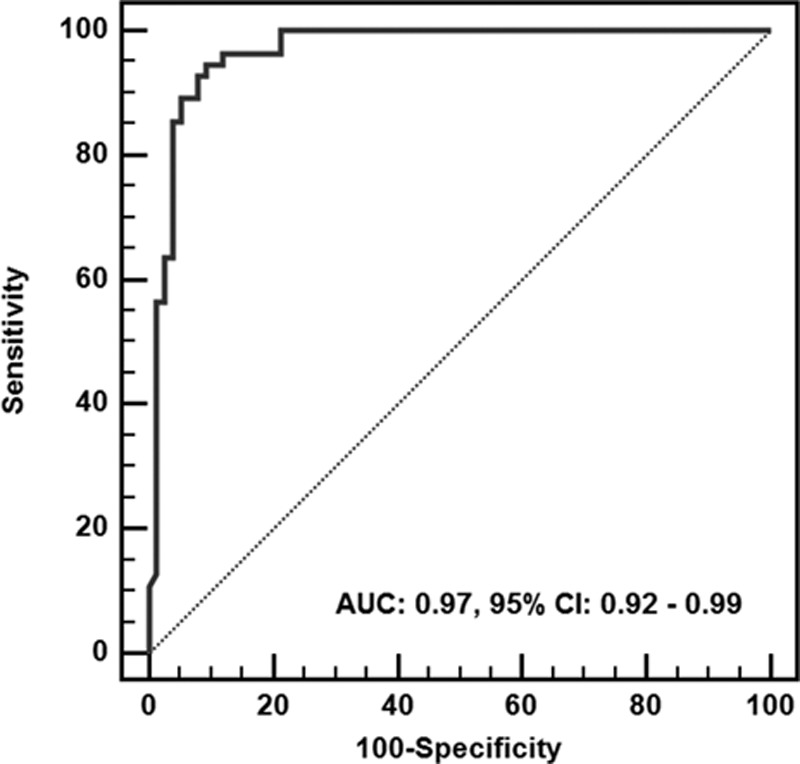
Figure 4.

Receiver operating characteristic curve for the prediction of good neurological outcome according to the time to normal trace. AUC indicates area under the curve; and CI, confidence interval.

Receiver operating characteristic curve for the prediction of good neurological outcome according to the time to normal trace. AUC indicates area under the curve; and CI, confidence interval.