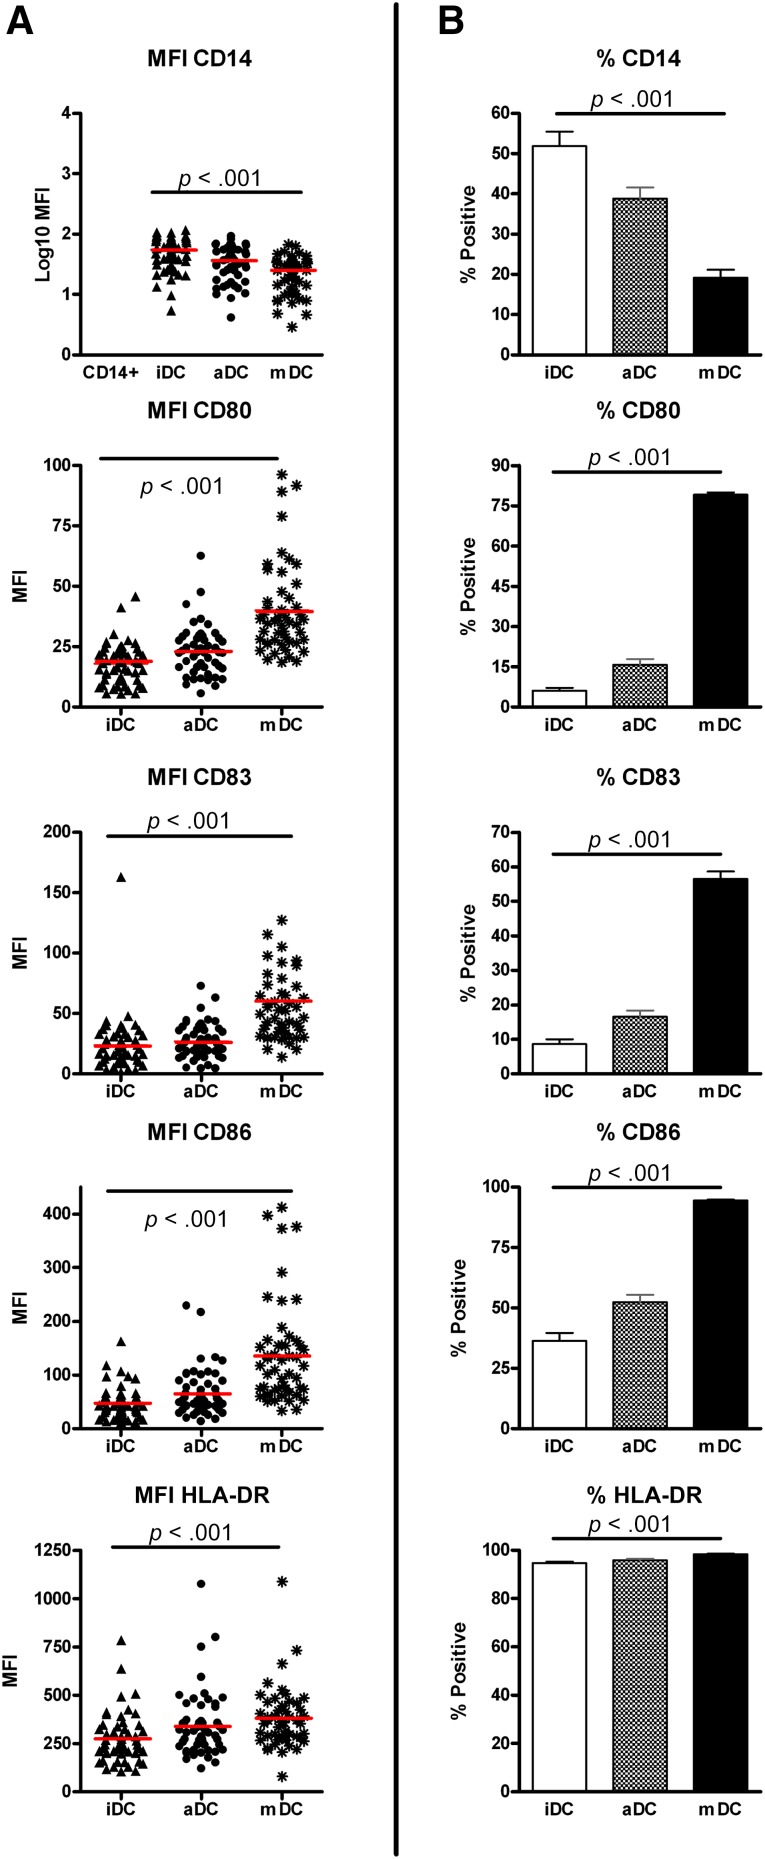
Figure 1.
Flow cytometry analysis of the DCs at different steps of maturation/differentiation. The figure shows the analysis of differentiation (CD14 downregulation) and maturation markers (CD80, CD86, CD83, and HLA-DR upregulation) during different steps of culture. (A): MFI was compared with the total percentage of positive cells for the same markers (B). The comparable trends confirmed the success of the differentiation/maturation procedure. Statistical analysis comparing iDCs and mDCs showed a significant difference in all 54 batches for all the markers analyzed. Red lines indicate the mean values. Abbreviations: DC, dendritic cell; iDC, immature dendritic cell; mDC, mature dendritic cell; MFI, mean fluorescence intensity.

